Tag Archive for: Networks

Facebook/IDC study finds, email top activity on smartphones

Some say, email is a dead media, some know it is not. At least not on smartphones in the U.S… For American adults email is still the most common activity on smartphones. In the second place comes Web browsing, closely followed by using Facebook. This is the result of the “Always Connected” study from IDC. The study is based on feedback from more than 7,400 iPhone and Android users between 18 and 44 years old.

IDC Facebook Email top 2013These are the main findings of the study….
– 78% check email on smartphones
– 73% browse websites
– 70% using Facebook in some way
– 131 minutes per day communicating on their smartphones
– about 33 minutes of the above are spend on Facebook.

Now, it has to be mentioned that the study was sponsored by Facebook. The study supports the fact how important Facebook is for the communication via smartphones. It also makes clear how much time users of social networks spend their daily time when they are out on the streets, at work, at shopping or following sports activities. Obviously, most of the time is spend on Facebook – in eight different activities, people responded that they are almost 4-5 times more likely to be on Facebook than using Twitter or LinkedIn.

IDC Facebook Facebook Twitter LinkedIn comparison 2013

Spot On!
The value of the study can in some way put into question, although we have seen many studies in the last years that demonstrate the importance of direct one-to-one communication on Facebook and the mobile use of Facebook. Another study by Localeze/15miles/comScore Local Search found that not email but search is the main activity of the mobile users. However, the approach of the study was different. It looked at people not only in the 18-44 years range and it proved the use of smartphones and tablets. there must be a reason why Facebook sponsored this study. I would not be surprised if they will publish some new mobile advertising opportunities soon.

Report: comScore unveils insights in main mobile development for 2013

comScore Mobile 2013In a recent report called “2013 Mobile Future in Focus” comScore released their outlook for mobile trends. The report shows the U.S. mobile and connected device landscape in 2012, which is meant to the set the stage for the international expansion of the mobile revolution. It offers insights into mobile media consumption, mobile networks, platforms, as well as OEMs. It also includes key mobile market insights from the United Kingdom, France, Germany, Spain, Italy, Canada, and Japan.

The report illustrates the following trends for the mobile year 2013…

Multi-mobile use shapes the “Brave New Digital World”
The U.S. is surpassing 125 million U.S. consumers and tablets in mobile consumption. More than 50 million own smart mobile devices which make consumers being always connected. Americans spend more than one out of every three minutes online on mobiles. Does this show the end of the desktop?

Smartphones surpass 50% penetration and start ‘Late Majority’ of adopters
In 2012 the U.S. smartphone market became the year of mobile by finally surpassed 50% market penetration. It enters the “late majority” stage of the technology adoption curve. Smartphone subscribers increased 29% from a year ago and 99% from two years ago. 72% of all newly-bought devices were smartphones.

comScore Mobile 2013 Smartphone Tablet Ownership

Android and iOS Control U.S. Smartphone Market
Google’s Android OS and Apple’s iOS dominate the U.S. smartphone landscape with almost 90% of the market today. The well-developed app ecosystems makes it even more difficult for competing platforms to narrow the gap.

Samsung makes splash in smartphone OEM market
Samsung strongly competes more and more with Apple that is still the leading smartphone OEM. The year-over-year increase of more than 100% from Samsung and a two-year increase of more than 400% shows how much they are challenging Apple. The gap between the two competitors is steadily narrowing though.

High-Speed mobile connectivity speeds up mobile content consumption
Wider availability of high-speed internet access has increased the average user’s media consumption experience. Default Wi-Fi accessibility for smartphones and tablets like in coffee shops contributes to the new workplace and a better browsing experience for users. But also the availability of better networks speed (4G and LTE technology) will leverage the mobile content adoption.

comScore Mobile 2013 Content Per Topic

Spot On!
The report shows that 2013 was kind of the “year of mobile”. With the rise of smartphone adoption to an over 50% penetration but also tablets becoming more prevalent, it seems that the world is moving more and more away from desktop internet usage. Mobile devices make up the digital media consumption of consumers these days. Obviously, marketers and media companies need to adapt their businesses to the emerging mobile multi-platform world but should also see the opportunity of mobile car technology (Google Glass Project), Augmented Reality (IKEA), QR codes (Adidas) or “mobile storytelling” (AUDI).

So now up to you. What has changed in your mobile adaption from last year? What are you missing in terms of mobile marketing development? And what would you be open for when marketers address you with mobile content?

Hey, Lufthansa! Not interested in Frequent Travellers?

SkyThere were days when I thought it is better to stay out of the discussions around the changed terms and conditions for Frequent Travellers and lounge access. A long time did my trips hit the airports with the lounges where Lufthansa still values the status of a Frequent Traveller (FTL) as a “superior customer”. “Acces granted for FTL passengers!”

Now, in just some weeks it happened to me twice that I got the answer: “Access denied for FTL passengers!” I think, it is time to write some words in order to give Lufthansa the chance to reply to all the clutter that goes live on the Web. So, Lufthansa – please listen up.

Amsterdam Schiphol and London Heathrow! In both airports Lufthansa cancelled their contracts with the lounge partners for FTL passengers. However, there are rumours going on that in 2014 when the new Terminal 2 opens, that situation might change. True? Wrong? We don’t know! Lufthansa, is not monitoring or listening it seems.

The lounge access topic might have some financial background. Still, I wonder if Lufthansa knows what kind of economical impact this might cause. Lufthansa, do you believe in the power of Social Media? Seeing your massive activities on social networks I assume you do. But, why do you not answer the conversation that is led by some link in position 1 on Google for the quest: “Lufthansa FTL London Heathrow”? Doesn’t that show how much Lufthansa values FTL passengers? Sorry, Lufthansa! In my eyes, you want to get rid of the FTL status. Correct…?

And let me give you another reason why I believe that. I am just illustrating briefly the situation of a business man traveling around Europe quite often, and in my eyes approx. 50 times is often.

If I am allowed to have access to the lounge, I don’t lose time. Time is money, is efficiency, is essential for doing my business. Access means: No need to find a quite and comfortable place, buy my drinks and food, or ask myself why I pay your Bought Media. Lufthansa, understand that FTL passengers think about the benefit of paying you the extra thousand year-on-year to get to that status?

Amsterdam, London, or anywhere else. The lounge is the main value for FTL passengers to continue flying more often with you than with other airlines. No access to the lounge means, I will fly i.e. British Airways, one of you biggest competitors for the UK region. And there are many obvious reasons for this i.e. in London Heathrow: Cheaper flights, newer terminal, nice gates, better shops with more popular brands, a Fish restaurant, and, and, and… Do I have to continue the list? No? Thank you, Lufthansa, for making my time efficient and my critic spot on. That’s what I want you to understand!

In the end, the “lounge-access-thing” is just a numbers game. I doubt that your stakeholders at Lufthansa is good in understanding how to scale the business. Sorry Lufthansa, but I doubt you are clear about the long-term effect this “multi-level-lounge-access-nonse” might cause. Why? Let me tell you what happens, if I don’t have access to the lounge. Quite frankly…

No revenue for Lufthansa
250,- EUR
Revenue for BA:
170,- EUR
(without tax, petrol & stuff – average deal, booked early in advance, etc.)
Personal or Company Win: 80,- EUR
Result: Me or the company can safe money or be drunk & data addicted (ok, I am…), if I spend that on a bar at the gates in Heathrow!

I don’t believe the lounge rent, my two drinks and one sandwich costs those 80 EUR, right? So, not granting access to lounges for FTL passengers on different airport makes me think whether…
a) Lufthansa is testing whether you kill the FTL status.
b) Lufthansa doesn’t appreciate the money of Frequent Travellers.
c) Lufthansa has not made their business homework.
Lufthansa, please tick!

Taken it from an Earned and Owned Media perspective, I would suggest you know how often people fly with you, how much you could do with that, how you could engage on networks, how this would catalyse your brand perception, what that would do with people usually flying some oither airline, how this scales in sales. If not, contact The Strategy Web and we will tell you how Social Media scales your business, Lufthansa, predominantly if it comes along in a positive way.

Did I make the benefit of lounge access clear to you, Lufthansa? Next time I am flying, I will make sure I get my travel assistant check the lounge access before booking the flight. I cannot believe you are not interested in our business (feeding you), our needs (scaling your business) and our money (enabling acceleration and growth)?!

Gimme some arguments why I shall still fly with you when I am busy…??? Come on, Lufthansa!

Buyral Spoof: How to make a video go viral with a professional clicking agency

Often we do get asked how to make a video go viral. Well, ehre is the answer… This Buyral video shows brand and companies how they make their videos go around the world of social networks. I am sure you all will love it! And here is our advice: Don’t take this video done by St. John too serious and don’t trust every agency that will tell you they know how to get your brands latest promotion to go viral. Maybe they also have some professionals with a fast finger clicking they videos like we assumed some straneg agencies were clicking banners years ago.

YouTube

By loading the video, you agree to YouTube's privacy policy.
Learn more

Load video

Study: Largest global corporates get over 10 million mentions a month; Twitter rocks, YouTube grows massively

Companies in the Fortune Global 100 get a total of 10,400,132 online mentions in a month. Twitter is the catalyst for them as it generates the majority of these mentions. However, YouTube is the rising star this year. This is the main findings of the third annual Burson-Marsteller Global Social Media Check-Up, which also includes new data provided by Visible Technologies.

The study states that the majority of the big corporates (87%) are using at least one of the major social platforms. The main growth can be seen at YouTube with 79% of companies now using a branded YouTube channel (57% in 2011). The average performance figures showed more than two million views and 1,669 subscribers. The development is illustrating the importance of integrating original multimedia content that can be shared on the social networks.

Twitter is still the rock-star among the popular social networks in terms of corporate usage. 82% of Fortune Global 100 companies have at least one Twitter account with an average mention of 55,970 times on the 140 character platform. The importance of Twitter ca be seen in the fact that stakeholders are following global companies closely.

Compared to 2011, the average number of followers per corporate Twitter account almost tripled to 14,709 from 5,076. On Facebook, the average number of likes per company page has increased by 275% in two years to 152,646 likes this year.

“People want to interact and connect with these major companies, and these platforms are the bridge directly to the heart of these organizations. What’s even more impressive is how much companies are engaging back with followers. Seventy-nine percent of corporate accounts attempt to engage on Twitter with retweets and @-mentions, and 70 percent of corporate Facebook pages are responding to comments on their walls and timelines.”
Burson-Marsteller, Chief Global Digital Strategist, Dallas Lawrence

Some more findings of the study…

– Fortune Global 100 companies have an average of accounts of: 10.4 Facebook pages, 10.1 Twitter accounts, 8.1 YouTube channels, 2.6 Google Plus pages and 2.0 Pinterest accounts.
– 74% of companies have a Facebook page
– 93% of corporate Facebook get weekly updates
– 48% have joined Google Plus
– 25% are on Pinterest

And whatever else you might want to know about the Top Global 100 you can find here, or within their infographic….

Tuesday generates highest engagement for social campaigns

Did you not ever want to know what the best day for a Social Media marketing campaign could be? Well, you can get some good indication with the following study…

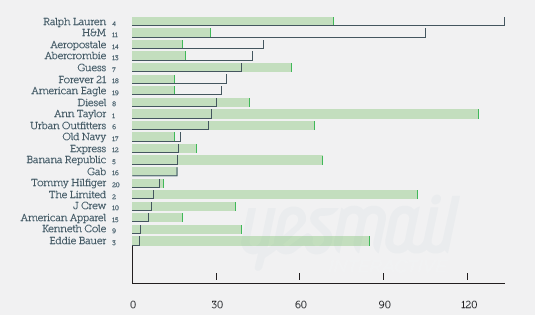
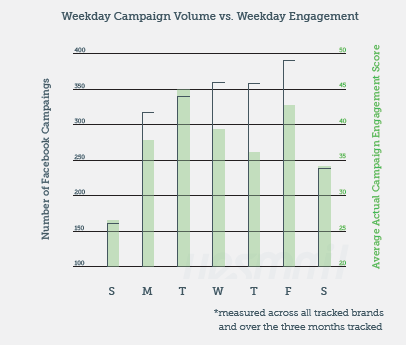
Many Facebook campaigns go live on Fridays. However, the day that generates most user engagement for a campaign on the social network is the Tuesday, which ranked only fourth in terms of the number campaigns conducted. These are some of the findings of a recent study done by Yesmail Interactive. The results are based on a three-month study of consumer engagement with online campaigns for 20 major retails brands, including Abercrombie & Fitch, Gap, or Ralph Lauren among others.

The study with the title “Using Digital Market Intelligence to Drive Multi–Channel Success” figured out the customer engagement of campaigns on the most popular social networks. In order to understand campaign engagement, it compared the relationship between “volume-based engagement” of Facebook campaigns (number of “likes” or comments a campaign generates) and “actual engagement analysis”. The finding is quite obvious, in that the lower the brand “likes”, the fewer likes and comments a brand on Facebook gets. Still, independent of the size of their fan base, some retail brands generate higher engagement levels than others through Facebook. Nevertheless, average-performing brands still performed as engagement winners, including i.e. Ann Taylor, Eddie Bauer or Kenneth Cole. 

Although, we have already reported that a balanced frequency in posting status updates is important for the success of a Facebook campaign, there is no blueprint and guarantee for success. The most engaging brands had deployed between 20 and 32 campaigns per month. Compared to the five least engaging brands with 54 campaigns per month, it becomes obvious that posting less frequently is better. From a timing perspective, the best Facebook engagement was generated for campaigns launching between 10 pm and 12 am Eastern time (EST) which was also the least-used deployment time slot.

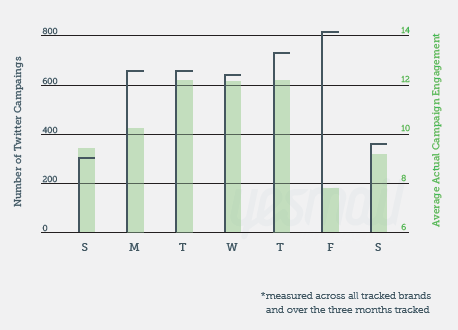
For Twitter, the research showed that most Twitter campaigns (20%) were conducted on Friday, which again is the least engaging day for such campaigns. Almost on the same engagement level performed Tuesday, Wednesday, and Thursday as those most engaging campaign days. Over 84% of all Twitter campaigns were deployed within regular work hours (between 9am and 7pm EST).

The performance of the 20 retail brands on Twitter showed big differences. Although Forever 21 came in first in terms of follower base, the brand’s campaigns showed significantly lower engagement among followers than the campaigns of brands with smaller follower bases.

The five most engaging brands did 45 to 70 Twitter campaigns per month on Twitter versus the five least engaging brands with an average number between 95 and 115 Twitter campaigns per month. It shows again that lower frequency is better than big blast promotions. If marketers want to generate high engagement, they should place their campaigns between 5 am to 6 am and 7 am to 8 am EST.

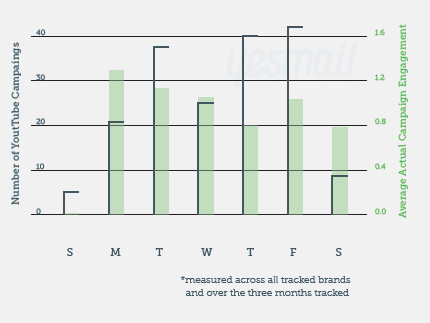
In terms of YouTube campaigns, the study found that 85% of the brands studied have a YouTube channel. Still, just 35% deployed campaigns during the research period. Some more findings indicate that on average, retailers conducted 3.5 campaigns per month during the study. The best day for interaction occurred to be Monday. Do we have to mention that this was the least likely day for campaign deployment? YouTube campaigns deployed between 2 am-3 am EST found the highest engagement rates.

The study is based on campaigns conducted from January to March, 2012 via Yesmail Market Intelligence. The selection of brands focusses on 18-35 year-olds as of their digital communication interest.

Study Gen Y: Moving communication to social networks

Many managers don’t believe that the next management generation might communicate differently from today. So, every proof we have could be beneficial to score here and it is necessary to obey the signs in every region in the world.

In India an increasing number of the Gen Y generation prefers to communicate via social networking platforms to stay connect with their peers. And they do it on mobile devices as their preferred tool for communication.

A recent survey called The GenY Survey 2011-12 by Tata Consultancy Services (TCS) asked 12,000 high school students between 12-18 years in cities like i.e. Mumbai, Delhi, and Pune from July to December 2011. It finds that a “total of 88% respondents from metropolitan cities had a Facebook account while other platforms such as Orkut and India-based Apna Circle, Ibibo and Hi5 were more popular in small metros”.

The study states that 40% of the Gen Y’s have internet access on their mobile phones. However, television emerged as the least favorite gadget with not even 1% voting for it. An emerging trend is the use of tablets with almost 14% using these new devices, it quotes.

Some more findings of the study…
– 85% use social networking sites such as Facebook
– 84% have internet access at home
– 79% own a mobile phone
– 28% value the mobile phone their favorite gadget

Spot On!
There are already 38% of respondents in metros using Facebook or Twitter to communicate. Tweeting is now being used by one in three students according to the study, though just 1% mentioned it as their preferred site. Text and chat were said to be the preferred alternatives to voice calls with 50% of respondents in metros explaining they used SMS most frequently to communicate, 45% used instant messaging. Apart from that, they also value information technology as a career option followed by engineering and medicine.

Will those who pin finally win? – Pinterest & Engagement (Infographic)

What is interesting for marketers is how engaging Pinterest could be as the emerging new social network for pics and tricks. So which gender is using the platform the most? How much time are people spending there, and how much time compared to other social networks?

Here are some answers (US perspective) according to Wall Street Journal
– Facebook stays as the most engaging platform with 405 minutes per month
– Pinterest and Tumblr come in second place with 89 minutes
– Twitter is number three with  21 minutes
– LinkedIn gets 17 minutes
– Google Plus only has 3 minutes

Please find the infographic “Pin it to Win it” from MDG Advertising as follows with some more interesting facts about some of the best performing social networks…

Study: Users „like“ brands for deals, discounts and coupons

Harald Wanetschka / pixelio.de

While Vitrue just found out how to get more “Likes” and engagement on mobiles, another new study by Nielsen/McKinsey’s NM Incite shows what the real value of “Likes” is. Although many brand marketers are working on the ROI, most companies still try to find some more value in the social engagement of consumers.

The Nielsen/McKinsey’s NM Incite global online consumers’ research states that the main reason for following or liking a brand or company on social networks is to receive discounts and special offers.
“While some may argue that consumers’ interest in discounts has faded, Nielsen data shows the desire for deals is still strong worldwide,” concluded NM Incite.

The results correspond with the study by ExactTarget and CoTweet from last year. The former study made clear that 40% of brand fans like a page predominantly for their doscounts and promotions.

The new NM Incite finds even higher figures. Almost 60% of US social media users visit social networks to receive coupons or promotions. And even more, 23% do this on a weekly basis. 45% of North American consumers had the strongest interest in using social media for deals, followed by consumers in Asia-Pacific (34%) and Latin America (33%).

Social deals hunters “Like” at home and at workplace
For most people it does not matter whether they are at home or at their workplace when using the benefits of the Social Web. A sample of ten major markets shows that nearly 40% of active Web users check coupons and rewards sites such as Groupon, Coupons.com and Living Social from home and work computers in September. However, there are respondents -under the age of 20 and 55- to-59-year-olds- who were less likely to follow brands for discounts. Here friends’ recommendations are the drivers for social engagement.

Spot On!
“Social deal hunters” are obviously also visitors of social networks and blogs. NM Incite found a strong overlap. In their test phase in September, 43% of visitors to social networks and blogs also visited a coupons or rewards site. And, 44% of Facebook’s audience and 63% of Twitter’s audience visited these deal sites. The study concludes that Facebook becomes a key source of traffic to Groupon and Living Social. Groupon’s and Living Social’s visitors came directly from Facebook. This also shows the link between deals and social networking sites, and how companies can motivate consumers to deals.

The Virtual Handshake

Marko Greitschus / pixelio.de

When I was a kid, my grandparents had a little pub. Nothing special. Nothing glamorous. Just a comfortable meeting point for friends or business partners to catch up for a drink. The best day always was the “market day”. Merchants were setting up their booths at the marketplace in the little village my grandparents were living in, early in the morning when most people were still snoring in their beds. When their job was done, they popped up at the pub around 7am when their wives took over to sell their goods.

The guests in the pub did not expect very much. A drink was their desire. A tasty sandwich was luxury to them. Competition amoung pubs was tough, even in this little village a long time ago. There were many pubs around in that coal distrinct north of Germany. The owners of the other pubs in the village changed more or less every year, some even earlier. My grandparents’ business stayed for over a decade, until they decided it was time to stop working. The guests loved their attitude, their individual touch, their personalized way of talking to them. My grandparents’ business was successful.

What was the key to their success story?

Before I answer this question, let me ask you something… When did you shake hands last time with a friend, or a business partner? Do you remember? Did you ever think about why we are shaking hands with people? Have you ever not returned a handshake? It is a common habit of introducing ourselves and of saying Goodbye. We just do it. Well, let’s say in the offline world we do it…

Those days, whenever somebody came into my grandparents’ pub, my grandma and granddad gave them a personal handshake, embedded in some small talk about the weather or last nights sports results. The conversation made people feel good, feel wanted, not just being anonymous guests. They created a living room. People started talking with them about their personal hopes, fears, issues. The handshake had broken the ice…

In our social web world of today, customer relationship management and social networking become an increasingly important factor to be maintain a successful business within a more and more challenging and competitive world.

Many relationships today begin with a virtual handshake. So you may ask: What is a virtual handshake? Today, it comes in the format of a comment on a blog post, a LIKE on a status update on a Fanpage, an introduction mail inside a social network, or an invitation to join a community (Facebook or LinkedIn or a company specific).

In the offline world, nobody would turn away and not return the handshake. However, in the online world individuals put effort in terms of writing, talking and engaging with companies and brands, making their brand passion transparent, or just opening their minds to “business” (or privat?) conversations. All of that often before having received a virtual handshake with those companies that are reaching out to them via their -often anonymous- social hubs.

By participating in a community or engaging in conversations, customers take the initiative, they state a case and describe an act of will. Companies tend to forget that this is a virtual handshake. “Hello! Here I am! Look what I am telling you…”.

Many companies and brands do not answer. They don’t reply on social networks. They don’t value the hand that is right in front of them waiting. The hand which feeds them and their business. The free opportunity to connect, collaborate, or convert. Lack of time and resources is the killer of many of their social web activities.

My grandparents never forgot to shake hands with people that came to visit their pub. This was their success story. So simple, right…?

Think about it next time you set up a group, start a community or approach someone on a social network (be it via InMail on LinkedIn or a status update on Facebook). Relationships start with a handshake – whether real or virtual. There just needs to be somebody that returns the handshake. For some this might be a change management process, for some it is just natural attitude towards customers…