Digital Content, and some stats how we use it in 2013… (Infographic)
Digital content readership is changing massively. And the guys at Uberflip have done some research around how data was used between February 2010 and February 2013 via Google Analytics and Uberflip Metrics. The infographic that highlights their findings shows how much mobile content usage and consumption is evolving, as well as how much content is shareable.
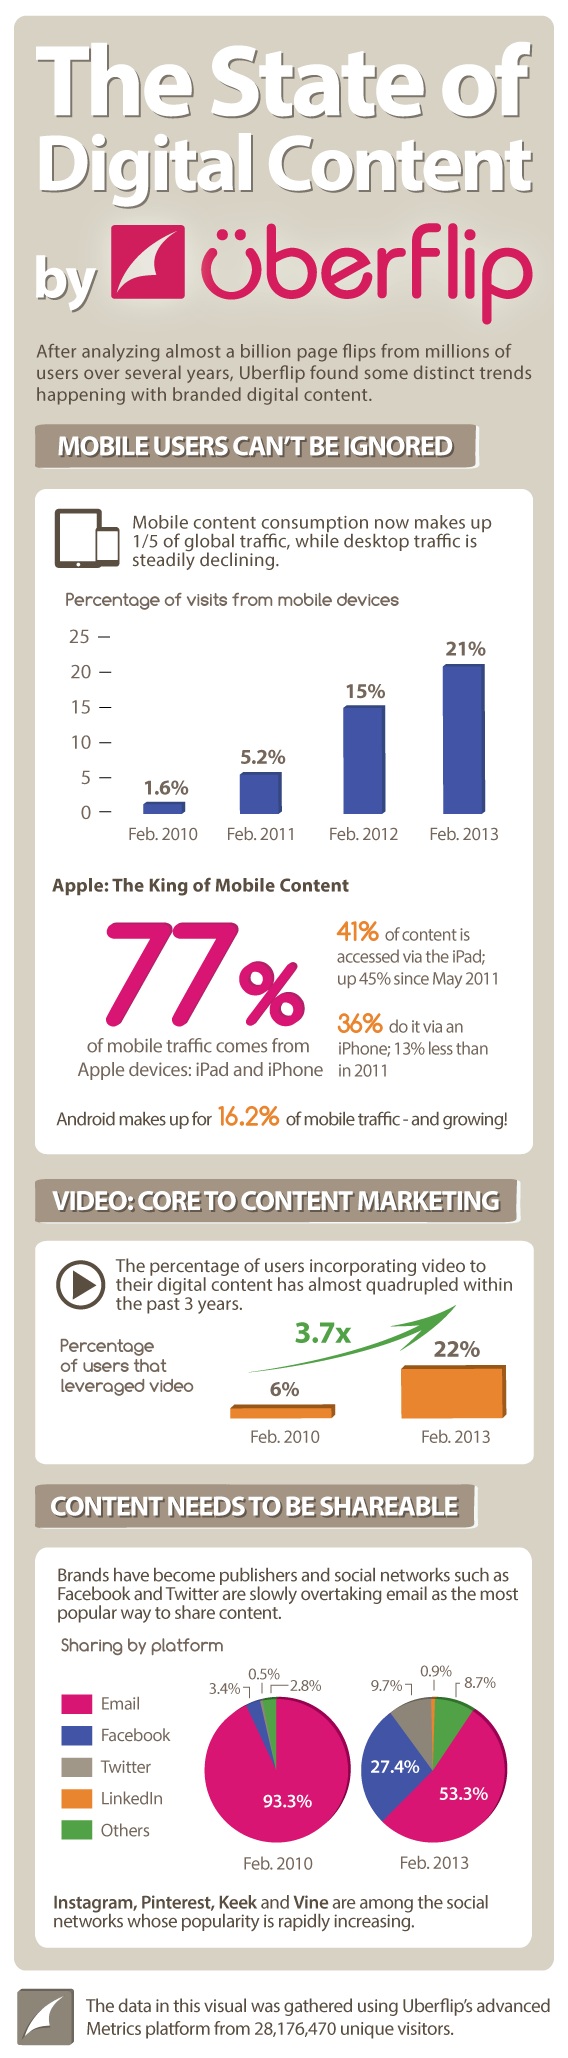
From a global perspective, mobile content consumtion in terms of visits makes up 21% (from 1,6% in 2010) while desktop traffic is decreasing continously. But mobile is not the only winner in this field. Video is increasing massively as well since 2010: 22% (from 6% in 2010) of internet users are putting video into their content portfolio.
People also change their way of sharing content these days. While in 2010, users were used to sharing their content via email, in 2013 the figure of sharing content via email went down to 53.3% in February 2013 (from 93.3% in 2010). Facebook and Twitter seem to be the big winner here: 27,4% of people are sharing content via Facebook (compared to 3,4% in 2010), and 9,7% via Twitter (compared to 0,5% in 2010).