Tag Archive for: Infographic

2014 Trends in Content Marketing [Infographic]

The perspective of Uberflip “predicts” that there are some obvious trends coming up in content marketing.

Not surprisingly, a “director of content” might be the new team member in companies. This might be nothing new when compared with our job title predictions for web strategy at the beginning of 2013. Some other aspects of Uberflip include: higher quality of content, content curation, multiscreen marketing, and what every consultant will love: bigger budgets for hopefully better content.

“Brands will step up their game by integrating great journalism and storytelling into their strategies,” states Uberflip.

Let’s hope their predictions proof to become reality. Or maybe, you see some other development in the near future. Why not share it with us…?

Content-Marketing-2014-infographic

How fast the leading social networks are growing…

It is one of these questions, we always get asked in meetings and seminars. How much is social media growing, or is growth already declining? Search Engine Journal provides some good overview on the topic of growth and use in an infographic just recently released.

The most popular sites -in terms of how they are used by marketers- are still Facebook, Twitter, and Google+. Same as in the study from Global Web Index in 2013, Twitter still shows the fastest growth in social networks from an active user perspective, especially in the 55-64 age group.

In the time period from June 2012 to March 2013, Google+ increased their active user base by 33%. The age group of 45-54 years showed the fastest adaption growth in Google+ with a 56% increase.

And Facebook? Although they showed a 23% increase, especially the age group of 45-54 years is adapting the fast moving “Likes and Hypes” network.

SEJ-Social-Media-Growth

Tips & tricks on handling blogger advocates (Infographic)

Many marketers ask themselves (and often us) how to work with social influencers or blogger advocates. How can you get them to the some word-of-mouth promotion for your brand, how to spread the word about the company, or just to help on doing some nice networking. The team from SocialChorus gives some advice with their latest infographic on blogger advocates.

According to their opinion and advice, companies and brands should watch out that the blogger advocate of interest has got at least a social reach of 2,500-25,000 contacts on Twitter and a highly engaged audience. Furthermore, they should be “interested in brands that reflect his or her audience’s interests”. From a verticals point of view, the most popular verticals for blogger advocates come from parenting, women’s lifestyle and food. To be fairly honest,

I was a bit surprised that the tech industry was just getting some 4,8% of mentions as most of these people are in the social media platforms for quite a while, and usually these people are quite engaged. Seems this is not a big vertical when it comes to spreading the message about brands.

However, each vertical can also have some subcategories which means that it could be covered but under a different vertical like i.e. consumer interest. Not surprisingly, the typical women’s lifestyle blog is around beauty, fashion, and design/DIY, while the males’ one will focus more on auto, sports, tech or entertainment.

Spot On!
To be fair, I have to say that I doubt that the number of 2.500+ contacts qualifies for some great advocate impact (maybe more for an influencer), or whether it is not more the people behind those contacts that count. Marketers should also be careful with the “engaged audience” as sometimes people get followed as of their unique content. They get high figures in “automated response” but they might not be the most conversational, still fully respected people.

Hey, who said blogger advocacy was easy? Any further ideas on the topic, feel free to share…

Credits: SocialChorus

Credits: SocialChorus

Content: Secrets of a killer blogpost (Infographic)

Many marketing, PR or product managers think about starting their own blogs when joining one of our inhouse or open seminars. And for most of them, it has become a challenge just finding the right topic that makes them outstanding with their product or service offering. This is not surprising, bearing in mind that there were already 74.874.233 WordPress websites out there when I wrote this post – and when you think about Blogger, Typepad, Tumblrs and all of those enterprise blogs, it becomes a mission impossible to find a niche that helps building brands.

Now, the guys at WhoIsHostingThis.com have published some helpful infographic which give us some quite good arguments on what matters when you start blogging.

Which Content?
There is no magazine without a smashing title. Ideally, you write about the topics you are an expert in. As people will want credible, meaningful and authentic blog posts, this is the only way to get your readers attention. Then, check out what readers do want, discuss and share on your topic via social media monitoring. This will make your content interesting and will prevent you from writing content that nobody reads.

Original or Curated?

If you have got the time to write original content, go for it. It’s the best for your reputation and shows your own mindset. And most importantly, Google likes original content which is more likely to rank better. Whenever, there are guest bloggers who want to contribute to your website, invite them.
However, the truth is that if you curate your competitor’s content or third party content from time to time (with a back link!), you jump into their fish-bowl. The easiest bit is if you use their infographics, webinars and branded industry blogs to expand their ideas and thoughts.

Consistency? 

Find your style and stick with it. People want to feel “at home” and comfortable. Figure out when most people share your updates, or when it’s better not to send them live. If you can afford it, stick to an editorial calendar as people love publishing source they can rely on finding the relevant set of information that stands out.

Good luck (and if you need help), we are here to advice…

How-to-Write-a-Successful-Blog-Post

Best and worst times to post social media updates (Infographic)

The questions we get asked by management team all over Europe are quite similar whenever it comes to best possible conversion times, or perfect hours and days to posting on social networks, to send out updates and to generate engagement. Although this might be an option to boost your social and web activities, it should be clear to everyone that if we all obey these options, we are challenging our clients more and more in generating engagement.

Above all, not all social media platforms are alike. The user types of social networks are different, depending on whether these are coming with a purchase intent, the idea to keep their friends up to date about their latest spare time activities, or whether they are looking for new job opportunities in career networks. Sentiment, time and openness for your updates might vary from minute to minute.

Mitt Ray summarizes some advice on when could be the best and worst time to publish your updates on Facebook, Google+, Twitter, Linkedin, Pinterest and Tumblr. Take it for whatever it is worth to you…

Best-Times-and-Days-to-Post-Your-Social-Media-Updates-Infographic

How social search helps marketers boost their brands (Infographic)

How important do you see social search for your brand or your company? Not much. Well, you might reconsider this answer when you have read some of the stats provided by Prestige Marketing in the following infographic.

The compilation of figures and data gives some insights in why brands need to understand the benefits of social search.
– When exposed to relevant branded media, consumers are more likely to click your information: search click-through rates increase 94%.
– Comparable to the Nielsen findings some months ago, 78% of consumers trust personal recommendations over search result rankings.
– In order to make purchase decisions, 48% of digital buyers use search and social media for their buying decisions.

“Social search engines use data from social networks and online relationships, including rating, shares, and likes, to determine the display order of search query results,” claims the infographic.

The following infographic will tell you more about a toppic you might not really be spot on…

trends-in-social-search-infographic

Infographic: How proximity & micro-location marketing offer new possibilities to marketers

In a consumer world that is becoming more and more mobile technology driven, the outreach to customers depends on sending the right message at the right time in the right context with the right content impulse. Retail marketers need to be aware of how micro-location and proximity marketing will connect them with those early mobile adopters.

And just imagine how marketers can target their customers just when they are taking their purchase decision. Only as mobile technology and relevant data will let marketers know in which shopping experience the potential customer is.

Like a “look over the shoulder” of their customers, retail stores can now use mobile and targeting technology to better understand the purchase behavior of their customers. Sensors and Bluetooth low energy (BLE) beacons enable marketers to track and target those buyers in retail stores from the minute they walk in the door, and always send them relevant personal promotion content.

This infographic by MDG tells us that only 23% of marketers are using location-based data in their current mobile campaigns. Still, this technology will be changing the marketing approach in the future. As ore and more marketers are heading towards micro-location marketing (this marketing tactic is expected to reach $2.3 billion globally by 2016), it will depend on the customers whether they will accept this real-time marketing and hyper-targeting advertising formats.

infographic-future-of-proximity-and-micro-location-marketing

The Viral Spiral: An Interactive Infographic by Unruly

Unruly Viral SpiralIn an interactive infographic called “The Unruly Viral Spiral”, we get to see the value of social video and what it has achieved in the last eight years from 2006-2013. The graphic visualises that the top three branded videos have massively increased in shares. Since Old Spice had their massive success the top three brands have seen an increase of 613% since 2010. Interestingly enough, this year beats all records. 40% of the top 20 videos of all-time came out this year. From these, the leading ten generated 28,8 Mio. shares (an increase by 52% since 2012!).
Click on the button to load the content from viralspiral.unrulymedia.com.

Load content

History of Hashtags (Infographic)

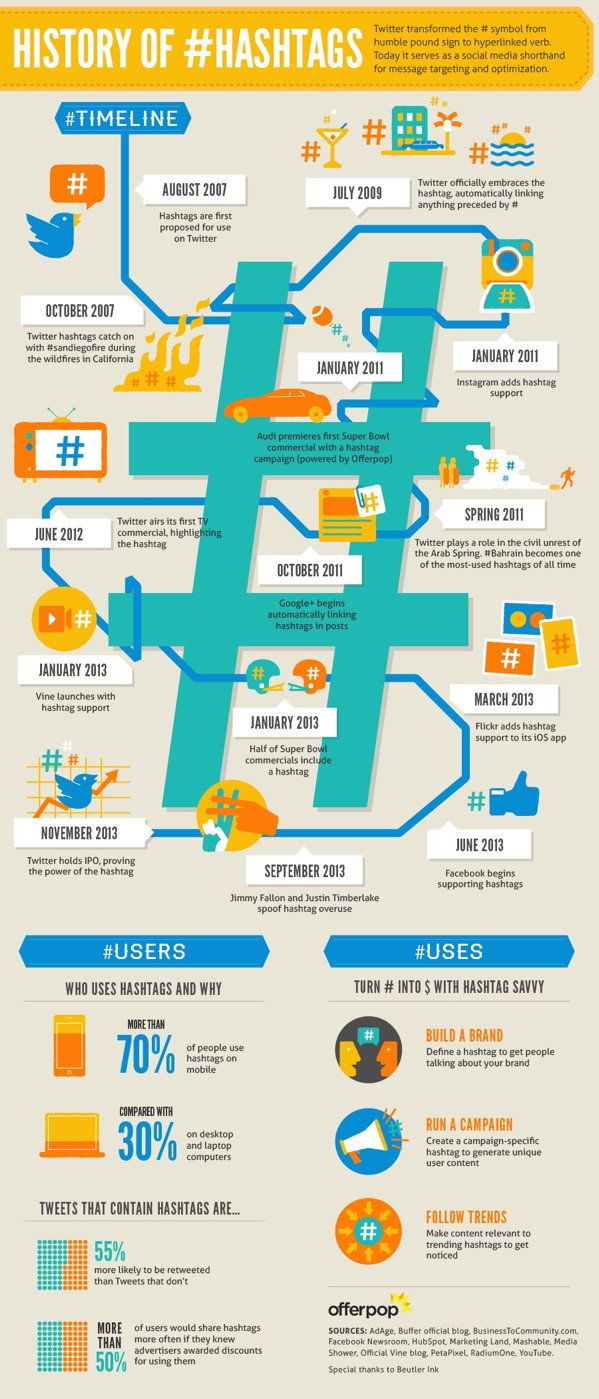
Whether you use hashtags “#” or not, they have made their history since first introduced in 2007 by Twitter. They became the filter, not only for Twitter – also for special topics, for branding, for trends, and for what not.

Although many people ignored hashtags from the beginning on the social platform, they find more and more acceptance today, now that people know why they are in the world of social web communication. Their real increase in use cam with the year 2009, when the 140 character network decided automatically linking anything preceded by the pound sign.

Nowadays, if you want to get retweets, you better use hashtags as these tweets are 55% more likely to be shared than those without any #. Even Google+, Facebook, Instagram or Vine have started to accept the hashtag value. And Offerpop now introduced an interesting infographic which shows the history of the hashtag.

PS: Interesting to see that more people use hashtags on their mobiles than on their laptops or desktops. Mobile information is consumed in short time periods, so you better make sure people grab your information when they jump on the bus, the train or at a break at an event. Hashtags are the access keys!

History-of-Hashtags-Infographic

The evolution of the mobile etiquette (Infographic)

Human interaction gets disrupted by new technologies like smartphones and tablets. Yet, we are still trying to figure out and learning how to engage with our mobile devices when other people are around. Time to rethink (mobile) etiquette. When is it ok to check our mails on our phones? At dinner with friends or during a conversation in a restaurant? There is no golden rule these days, and many people might define their own etiquette.

A recent infographic gives some mobile advice with some new etiquette ideas. The infographic by Deals.ebay.com is based on some studies which show some insights in mobile users opinions. The younger generation age 18-24 have obviously a quite relaxed understanding on how and when to use mobiles: 50% of GenY think texting is allowed during meals – compared to just 15% of people aged 30 and older.

PS: One term was even new to me: Phubbing -a short version of phone-snubbing. But, check it out yourself – and if you got some advice, start the conversation.

Via deals.ebay.com

Via deals.ebay.com