Tag Archive for: Infographic

Mobile & Responsive Design: Hype or Hope? (Infographic)

It is a dream for many people responsible in the developer field: Creating a mobile app once, without the need to amend it for any screen, any device or any audience. Responsive web design is said to be able to deliver just that – one size design fits all kind of a thing. But is it really true?

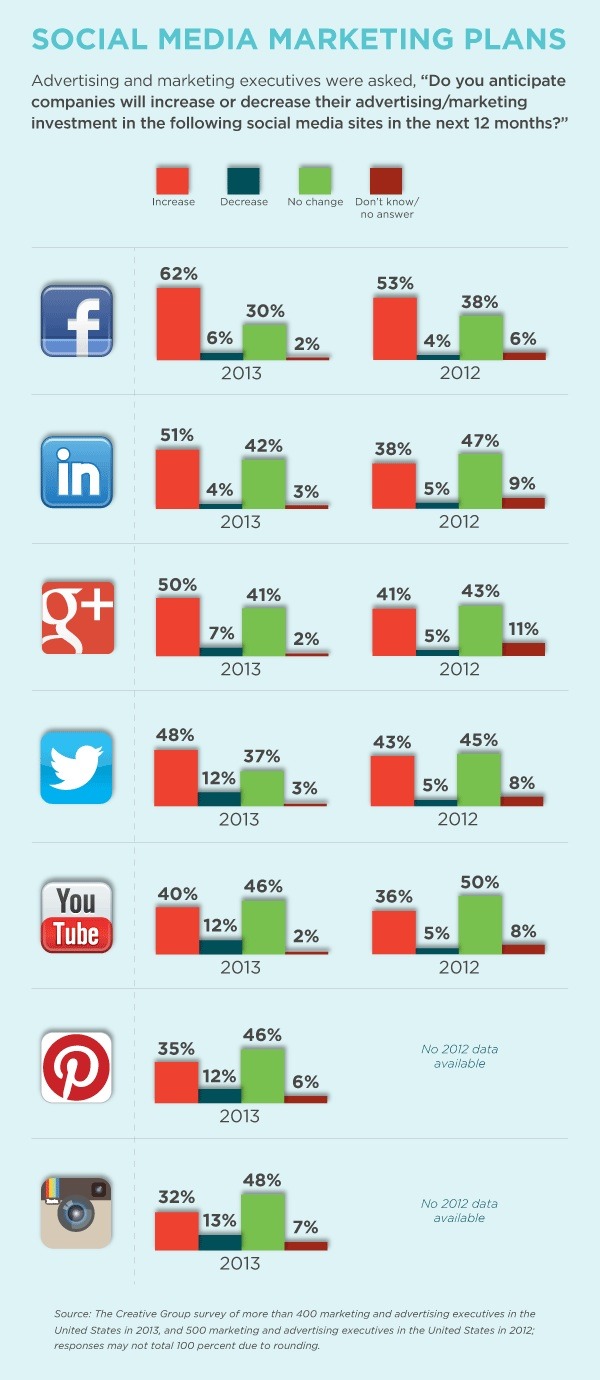
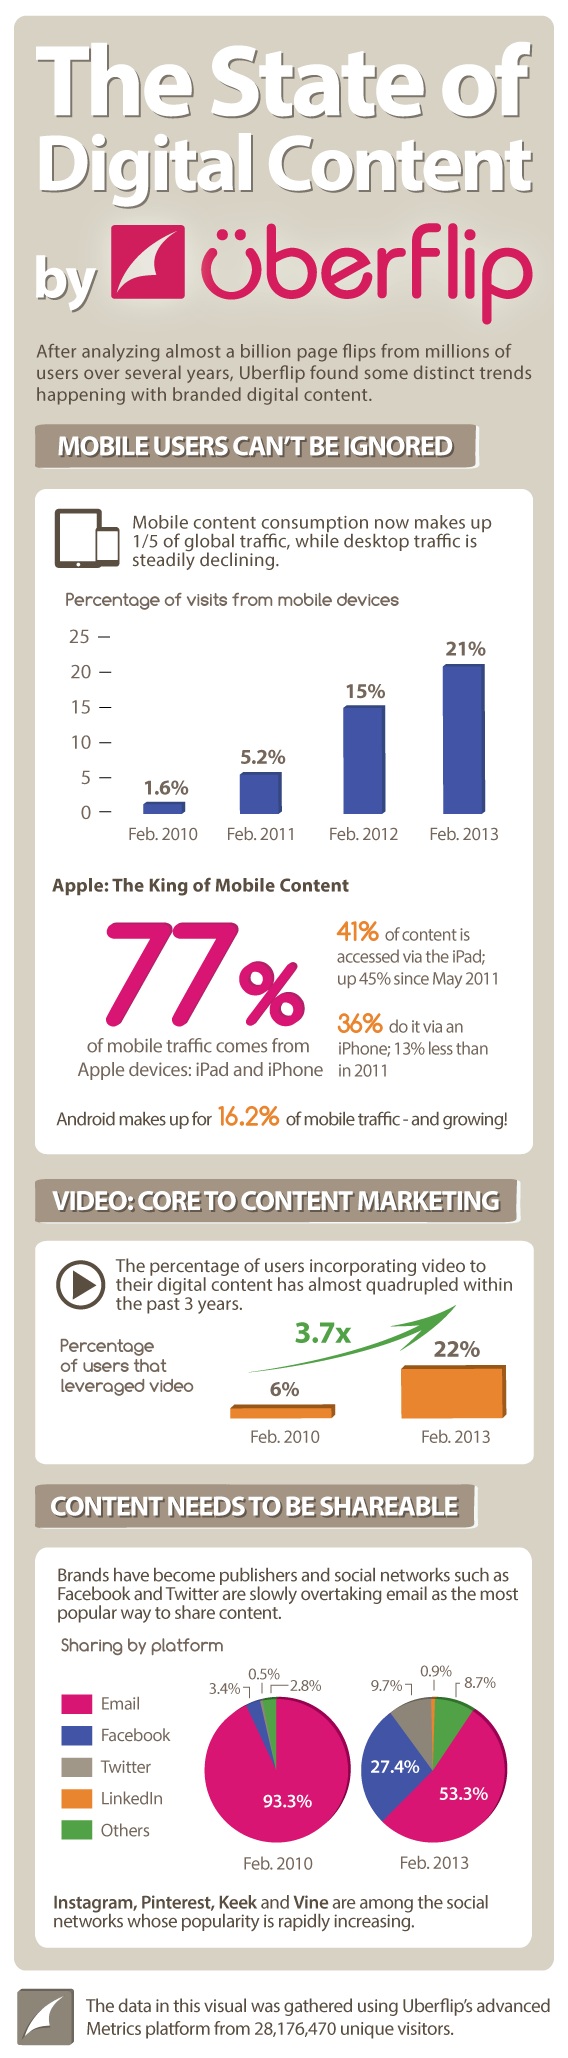
In days where more than 20% of all web traffic is generated via leading e-commerce websites coming from mobile devices, responsive web design is becoming an alternative many developers are thinking about. Not surprising, right?! The unique screen resolutions has been growing from 97 in 2010 to 232 in 2013. For those retailers that wanted to rise the number of online shoppers alongside with the growth of screens coming via not desktop resolutions, responsive design became a new and attractive option.

For the marketing and web optimization guys from Monetate, it seems there is only one real alternative if companies don’t believe in their customers to download their mobile app: responsive web design. Still, mobile shopping is not a hype anymore, it has become the real revenue driver in e-commerce. There is an expected $38.8 billion spend on smartphones and tablets according to eMarketer in America in 2013 which is forecasted to grow up to $108.6 billion by 2017.

However, brands might argue that the development is not cheap at all. If you see another alternative or have the proof that responsive design is not the only alternative, let us know…

Responsive-Web-Design-Infographic

Study: Increase in marketers social spendings expected (Infographic)

With their recent study The Creative Group predicts that the majority of advertising and marketing executives (62%) expect an increase of their company’s spending on Facebook marketing in the follwoing twelve months – 9% more than they predcited one year ago.

Not surprisingly, the advertising spend on Facebook leads the list of social ad spendings. However, the majority of executives will also invest in other channels more than last year: LinkedIn (51% up from 38%) and Google+ (50% from 41%). Twitter is also on the plan for a budget increase with 48%, as well as Youtube (40%), Pinterest (35%) and Instagram (32%)

Although this shows a great breakdown of all industry sectors and job titles in an overview, the different industry segments and job titles varied in their view on budget increase:

Facebook
– Large companies (100+ employees): 74% of marketers expect an increase in Facebook spend
– Smaller companies (100-249 employees): 60% predict an increase for Facebook spendings

Twitter
– 57% of advertising executives expect an increase in spendings
– 48% of marketing executives expect an increase in ad spends
– 12% of marketing execs expect a decrease in spend
– 6% of advertising executives expect a decrease

The study was based on a US survey of 300 marketing executives and 100 advertising executives.

How about your marketing budget planes with Facebook, Twitter and the likes? Increase or decrease?

Forecast-Social-Media-Spend-2013

The Google Graveyard (Infographic)

“I think all great innovations are built on rejections.” Louise Berliawsky Nevelson

Although Google has been one of the innovation rock stars as a web company for years, it also had it’s nightmare. And nightmares usually end someone on a graveyard. The list is long and the guys from WordStream created a nice infographic which reminds us what did not work them.

The latest product that -despite a very intense but small fan group- did not make it, is Google Reader. But also other products that looked promising were laid to rest: Google Talk (instant messaging ended May 2013, however Google+ Hangouts is much better), Google Buzz (social networking ended Dec. 2011, messaging tool and microblogging) and Google Labs (ended July 2011, formerly called “a playground where our more adventurous users can play around with prototypes of some of our wild and crazy ideas, and offer feedback directly to the engineers that developed them.”).

Google_Graveyard

Google_Graveyard

Spot On – How to write the perfect post (Infographic)

It is something we keep being asked seminar after seminar. What is the perfect status update looking like on Google+, Facebook or Twitter? Well, the answer is there is no secret sauce. Or maybe there is now? The guys from Mycleveragency have at least try to define it and put in as much knowledge as possible. If it helps when all tweet and chat on social platforms at the same times, I might doubt here but still…

PerfectPost

How the viral video web world is emerging (Infographic)

Audio-video content and video content networks are on the rise. Not one company in the FMCG industry that did not try to start their own initiative around their brand or product in the last two years. From the hype of Social Media another hype was creaping up that many have not yet fully understood but think it might change the world of the advertising industry in the future: viral videos.

The advertising business hopes to make money through Youtube channels and the Google AdSense business. Google invested 100 Mio. US Dollars in the launch of new and original TV content for their Youtube platform, plus they built production studios in London, Los Angeles and Tokyo which might build up Google’s audio-video channel to become one of the main challengers for TV.

Next to the increase of vimeo traffic, more and more video advertising companies arise that produce content, media houses create content hubs as well as PR agencies. Obviously, social advertising companies like Unruly, hallimash or ebuzzing are doing their best to get bloggers implementing and writing about viral ads that their brand customers create. And in the end, the Social Star Awards will make all marketers happy when their virals have made it to become a “viral star”.

The following infographic by the Masters in Marketing Degrees offers some statistics on how the viral web video industry has emerged in the last few years.

The Economics of Going Viral

Digital Content, and some stats how we use it in 2013… (Infographic)

Digital content readership is changing massively. And the guys at Uberflip have done some research around how data was used between February 2010 and February 2013 via Google Analytics and Uberflip Metrics. The infographic that highlights their findings shows how much mobile content usage and consumption is evolving, as well as how much content is shareable.


From a global perspective, mobile content consumtion in terms of visits makes up 21% (from 1,6% in 2010) while desktop traffic is decreasing continously. But mobile is not the only winner in this field. Video is increasing massively as well since 2010: 22% (from 6% in 2010) of internet users are putting video into their content portfolio.

People also change their way of sharing content these days. While in 2010, users were used to sharing their content via email, in 2013 the figure of sharing content via email went down to 53.3% in February 2013 (from 93.3% in 2010). Facebook and Twitter seem to be the big winner here: 27,4% of people are sharing content via Facebook (compared to 3,4% in 2010), and 9,7% via Twitter (compared to 0,5% in 2010).

uberflip-DigitalContent-Consumption

CMOs: Feeling unprepared for digital challenges ahead? 4 in 10 say YES…!

Sometimes surveys bring out the final truth about the status in which chief marketing officers (CMOs) find themselves in. One of the latest reports by Accenture, titled “Turbulence for the CMO: Charting a Path to the Samless Customer Experience” was done with 405 senior marketers from 10 countries. It makes clear that almost 4 in 10 CMOs think they don’t have the right set up to manage their business challenges in front of them. They are missing the right tools, resources and people.

The annual survey shows a decline in 5% in preparedness compared to 2011. Especially, the digital transformation is lacking behind. Compared to 2011 10% find it challenging to improve their workforce’s responsiveness to digital shifts. Furthermore, CMOs also stated that they find it difficult to keep up the efficiency of marketing operations (8% increase!).

CMO Digital Orientation Accenture 2013

Some deeper findings indicate what CMOs main interest in the business will be. The most interesting observation in the results is that digital orientation has the biggest gap between importance and performance among the five marketing capabilities.

The top priority for them is profitable growth (87%) and operational efficiency (85%). The good point for agencies and consultants is that CMOs have this as a bigger objective that cutting their marketing budgets (58%). From a long-term perspective, consumer expectations for specific experiences have the biggest impact on marketing strategy (65%).

And I am sure, you will detect some more interesting findings in their infographic.

CMO Challenges Accenture2013

Study: How Companies Structure Social Media Teams (Infographic)

In a recent Ragan/NASDAQ OMX Corporate Solutions survey, PR Daily wanted to know from over 2,700 communication specialists in which way how their businesses use social media. Now, Go-Gulf.com took some of the data and created an infographic that ilustrates the main findings. Interestingly enough, and that is also what we are experiencing these days in our workshops and consultancy business, many of the compnaies have not found a proper way how to generate leads through social media although the capabilities on measuring data seems to be there. 


Find the main findings as follows…
86% companies just look at main data metrics like fans and followers.
80%+ companies only have 3 people maximum managing social media.
65% companies see time as the main challenge using social media.
40% companies wish to increase sales: main goal of social media efforts.
31% companies are capable to track the customer journey from social media to sales.

How-Organizations-Structure-Social-Media-Teams

A New Don: How the sales profession has evolved from the Mad Men era

As a fan of the series “Mad Men” TV series, I have to share this comparison of the sales profession development with you. When we compare the decades from 1950-2010, we realizte that there were some significant differences. From Don and his friends’ wild office parties and massive whisky as well as martini consumption to a straight organized reality where sales automation has taken over and social media rules the communication between people.

Although, we still here at the universities and in seminars from the advertising Gods like Leo Burnett and David Ogilvy, Don Draper’s world has seen a radical shift in sales profession. But in which direction…? The guys from Leads360 have created an infographic that defines the main trends we saw lately…
– 1960: In-person pitch.
– 1970: Door-to-door vacuum pitch.
– 1980: Not really specified in any direction…
– 1990: In the beginning email messaging, later customer relationship management (CRM)
– 2000: Social integration (Social Media)
– 2010: Intelligent sales automation

“Over the last 50 years, many of these fundamental sales strategies have remained incredibly valuable,” states the infographic. Maybe you find the reasons why when reading through it.

Today, we are talking of Facebook as the barbeque with “friends and fans” and of Twitter as the chatter at the toilet. Well, it seems that we haven’t moved away from socializing. Maybe we just need to add some drinks next to our screens…

The_New_Don_Infographic_Sales

Questioning banner efficiency? Native ads perform better than banner ads, says eye-tracking study

A recent eye-tracking study called “Benchmarking the Effectiveness of Native Ads” states that the visual attraction of native ads (52%) is more frequent than with traditional banner ads. The study which used eye-tracking tools was conducted by Sharethrough and the IPG Media Lab with the aim to identify the impact of banner ads of top brand on the web.

The main findings of the study were..
– 71% of respondents described native ads -based on the fact they had previously had a purchase intent- as “personally identify with”; this number stands against only 50% for banner ads
– 32% of respondents argued that a native ad “is an ad I would share with a friend or family member”. However, only 19% would do so with a banner ads
– 25% of respondents looked more on in-feed native ad placements than on banner ads
– Native ads achieve a 18% increase in purchase intent versus banner ads that get a 9% upside for brand affinity. 

Number-views-native-banner-ads-Sharethrough

Spot On!
The interesting point about this study or me was that native ads and editorial content move closer to another. Almost the same percentage of respondents said they looked at native ads (26%) next to editorial content (24%). However, they potentially spend more time viewing the content still compared to native ads.

Engagement-native-ads-content-Sharethrough

Is this another proof for the fact that content marketing is increasingly becoming important and moving in the spotlight of companies and brands? Maybe the infographic helps you find an answer to this question…

Native-ads-vs-Banner ads-infographic-sharethrough-2013