Will those who pin finally win? – Pinterest & Engagement (Infographic)

What is interesting for marketers is how engaging Pinterest could be as the emerging new social network for pics and tricks. So which gender is using the platform the most? How much time are people spending there, and how much time compared to other social networks?

Here are some answers (US perspective) according to Wall Street Journal
– Facebook stays as the most engaging platform with 405 minutes per month
– Pinterest and Tumblr come in second place with 89 minutes
– Twitter is number three with  21 minutes
– LinkedIn gets 17 minutes
– Google Plus only has 3 minutes

Please find the infographic “Pin it to Win it” from MDG Advertising as follows with some more interesting facts about some of the best performing social networks…

Pinterest: First facts & findings (infographic)

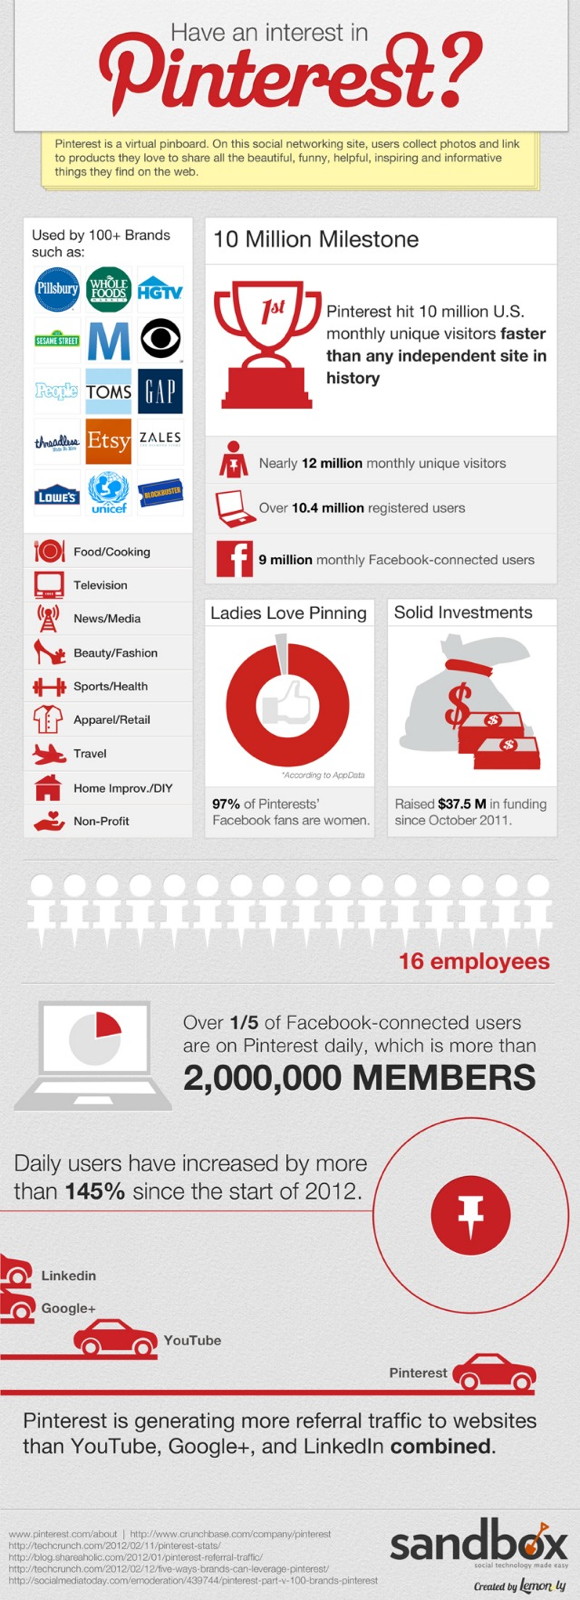
Pinterest is making the world crazy these days in 2012. Are you on it? Sure, most of the Social Media guys out there are exploring ways to make money with it. The funny thing is: You don’t need more than 16 employees to rock the Social Media sphere. That’s the actual size of the company.

A company called Lemon.ly collected some interesting data from the platform Pinterest. They found out that 10 million users are on Pinterest already, 97% of Pinterest’s Facebook fans are women, and it is obvious how the platform might have an influence on designers and marketers.

Some more findings and facts…
– 12 million monthly unique users
– 10,4 million registered users
– 9 million monthly Facebook-connected users
– 145% daily user increase in 2012

What is your perception of the platform? What is the main difference to picture and photo sharing platforms like Flickr, Picasa or Instagram? And what is the benefit using the platform from a business perspective?

ComScore study: 31% of banner ads get lost for viewers

© carlos castilla - Fotolia.com

Companies and brands love to book page impressions with publishers, shopping and trading sites. Users find themselves being bombarded with banner ads all over the web – and not often do these ads add any value on customer journeys and the digital shopping experience. Often they bore us (dresses and dishes), annoy us (gay ads for married people) or make us hate companies brands (you love a and get b beer brands). Real Time bidding (RTB), (Behavioral) Retargeting technology and demand side platforms (DSP) will become game changers in the ad space in the future.

Sounds good but do advertisers get what publishers promise today, just on the basis of ad impression buying? Well, not really…

Yesterday, ComScore announced their “Validated Campaign Essentials (vCE)” which is said to be a Holistic Measurement tool for verifying the effectiveness of advertising campaigns and their subsequent targeting tactics. Thus, ComScore can double-check of where the ads are being delivered, where they are positioned within a page and who’s eyeballs they meet with the optimization add-on to know where they can be better positioned and at what time. The new technology or tool (vCE) will allow ComScore check campaigns effectiveness on a demographics basis.

ComScore definitely recognizes clients need for a world of better performance with campaigns for a reasonable future of advertisements. However the good news, when you worried about the effectiveness of your last campaign, there is much worse stuff to think about…

ComScore has found, in a recent comprehensive study, that over 31% of online display ads get lost for eyeballs of potential viewers, and for some websites it is even a scary number of 91%. Reasons are obvious: Some of these ads are below the fold. User might not scroll down far enough to view them, and vice versa. Some people just scroll too quick and thus get passed them before they have been loading.

The findings also state that as many as 15% of campaign ads were delivered to viewers outside of the targeted media plan places. An average of 4% of ad impressions found viewers in locations that weren’t on the plan, or where products weren’t available. Do you still wonder why the above mentioned banner campaigns reach us? But ComScore works on the issue…

“One big issue with internet advertising is that not all ads that are served end up being seen. This is a core issue raised by the Making Measurement Make Sense (3MS) initiative. In order for marketers to have the same confidence in the digital channel as they do in TV, we need measurement around the visibility of ads.” Mike Donahue, EVP, Strategic Partnerships, ComScore

Spot On!
Google will penalize companies and platforms that have too many ads above the fold in the future: 3 ads per page is sufficient and strategically clever, Google advices in this video. Just imagine your banners are being delivered to platforms that are damaging for your brand. It happens. Impressions appear beside content that were defined as “not brand safe” by the advertiser. Of all tested campaigns, 72% showed up on pages that had objectionable content, as defined by the brand. Now, that ComScore and advertisers like Chrysler, Discover, E*TRADE Financial, Ford, Kellogg’s, Kimberly Clark and Kraft among others push the development of the third-party tracking, there might be hope that consumers and clients get banners delivered that are targeted the right way. Nevertheless, companies need to start thinking about the right call-to-action in order to get the right conversation figures…

How a campaign brings multiscreen couples together

Many families, and especially couples, experience new formats of evening togetherness. Couples are not leaning back any longer and simply watching TV, or having relaxed chats next to it. With most couples, both partners are using their smartphones, tablets or notebooks to chat with friends, to update their status for their fans and keep in touch with their digital fellows while the TV sceen is fighting for viewing figures.

Did you realize that TV gets the former status of the radio in our digital world? People listen to TV but are actively engaged in something else, in another screen conversation, in a multiscreen reality. Mobile becomes the new prime time. Radio always was the number two from a user attention perspective. So is singlescreen attention today, it is out, digital leads. Multichannel is the big future, and the looser is… the personal relationship. We all know how relaxing it is to lean back, and how TV reduces our “most emotional relationship activities” to a minimum, multiscreen usage could become a limitation catalyst.

But there is hope…

CP+B has thought about this development, maybe not… Still, they tell us in a new campaign how couples most commonly book trips. They have created a 2 for 1 campaign for Scandinavian Airlines. The campaign called “Couple Up to Buckle Up” was launched in banners, emails, facebook app, or print ads, and used two unique QR codes to bring people closer together again, i.e. to book a flight to Paris together.

In the campaign approach, couples need to scan the QR code assigned to them. Then, they would sync their half of a video based offer and reveal the discount code split across both screens. Bit of a challenge to scan/play at the same time but still a nice idea on a critical relationship topic.

And maybe this will help to… Well, you decide!

Vimeo

By loading the video, you agree to Vimeo's privacy policy.
Learn more

Load video

Couple Up to Buckle Up from Tobias Carlson on Vimeo.

National Geographic makes Augmented Reality go live…

The opportunities to attract peoples’ attention are increasing with the use of Augmented reality. Appshaker recently launched a fantastic way for people to interact with the world of National Geographic Channel’s content from around the globe. The set-up obviously took some budget. With the use of augmented reality, people could virtually interact with different scenes in which they were able to get in touch with dolphins, leopards, the space landings, dinosaurs and more.

The result..
1000s of people interacted with the National Geographic Channel brand in the process as it toured Hungary, with 1000s more people sharing snapshots and video on Facebook as a result.

Vimeo

By loading the video, you agree to Vimeo's privacy policy.
Learn more

Load video

Live Augmented Reality for National Geographic Channel / UPC from Appshaker Ltd on Vimeo.

LinkedIn, Twitter or Facebook? Study finds leading social network from journalists…

What’s your guess? What is the leading social network for journalists? And what does this mean to business decision makers, managers and PR professionals?

The answer by far is LinkedIn with 92% – with a remarkable increase of 7% compared to 2009. However, this does not mean that it is their main source of information. At least, this is what the latest study tells us which is called 2011 Arketi Web Watch Survey: Inside BtoB Media Usage of Social Media.

For me it was a bit of an eye-opener as I thought journalists might prefer to use Twitter to monitor sources for trending topics and breaking news. Probably, the statement has some value still. For Mike Neumeier, Pricipal, Arketi Group was not surprised…

“It comes as no surprise more BtoB journalists are participating in social media sites, especially LinkedIn. (…) LinkedIn provides an online outlet for them to connect with industry sources, find story leads and build their professional networks.”

The second largest still is not Twitter. It is Facebook. 85% of journalists are on Facebook (increase by 30% to 2009). However, Twitter comes in nearly at the same result (84%) and with the highest growth of 60% to 2009. And nearly half of the responding journalists (49%) say they blog or read blogs regularly.

“When compared to the 2009 Arketi Web Watch Survey, this year’s results show significantly more journalists are using social media tools (…) This means companies have more online channels through which they can reach media targets. This is both a blessing and curse for today’s PR professionals.” Dr. Kaye Sweetser, associate professor of PR, University of Georgia’s Grady College

Findings where journalists have their news sources…
– 80% via public relations contacts
– 77% rely on news releases
– 74% turn to newswires (i.e. BusinessWire or PRNewswire)
– 71% get from email pitches
– 56% from blogs
– 44% from micro-blogs (such as Twitter), and
– 39% from social networking sites (such as Facebook, LinkedIn and Myspace).

More than nine out of ten journalists responding (96 percent) say they prefer to receive news releases via email from companies they know, and 95 percent of business journalists say they prefer to receive news releases via email from companies they don’t know but are in industries they cover.

Journalists get crucial information regarding breaking news from the following sources…
– 85% Industry experts
– 81% Company website
– 80% Industry website
– 80% Other interested parties
– 57% Industry blog
– 53% Company blog
– 41% Industry Twitter feed
– 33% Company Twitter feed

Spot On!
Although LinkedIn is very popular among journalists, it does not seem to be the centre of attention to get a big story. Still, the direct contact and company websites have massive power and as they are probably the most trusted sources, they still lead. Still, social networks make it easy for journalists to get in touch with relevant people for good quotes. It should assume that investigative journalism is on the rise. Reading newspapers and websites today, I personally get the feeling that blogs have far more to offer.

What is your view?

Marketing automation – A sleeping lead generation star…?

Although companies get flooded with information concerning the benefits of marketing automation, the topic is still “not self-explanatory” to most marketers. The majority of B2B companies understand the general benefit in principle. Nevertheless, only a few are using marketing automation yet (7-10%). It seems that marketing automation is a sleeping star…

Still, the market for marketing automation is growing as you can figure out from the numbers below. Not surprising. The solution providersfor marketing automation proclaim an increase in lead generation and explain companies how easy it is to manage the sales lead funnel. And generating leads is what drives the B2B world around…

The annuitas Group just recently published some statistics from numerous sources that summarize the marketing automation market and published an interesting infographic.

– 110 vendors are seeling products and solutions in the marketing automation space
– 81% of best-in-class companies see the benefit in closing deals faster
– 76% of marketing decision makers see generation of high-qualified leads as the biggest challenge
– 64% of them have neither an internal nor external process to manage marketing automation
– 36% use marketing automation for lead nurturing
– 451% increase in qualified leads get businesses that use marketing automation for lead nurturing
– 47% more closed werde generated via lead nurturing generiert
– 10% use marketing automation to follow up later in the buying cycle

Spot On!
The statistics illustrate the power of marketing automation and what it could do to lead generation. However, when companies use marketing automation, only 25% use the full potential of marketing automation. It has become a “must have” in the marketing departments, at least of enterprises. If small and medium-sized companies use marketing automation or their a pre-sales/telemarketing to leverage their marketing and thus sales potential would be an eye-opening statistic in these terms. In many cases, time and resources hinder most companies from diving deeper into the potential of marketing automation and thus their brand content, the context in which it appears, and the community that talks about their business, products and services. The approach that I came across the last three years was an outsourced solution to service providers like agencies, publishers or software providers. And the main challenge of lead generation and nurturing is to align marketing, sales and customer service for a more efficient web strategy.

Would you agree that marketing automation is still a sleeping marketing star for lead generation…?

LinkedIn – The future of career advertising goes social…

About one and a half years ago, the guys from Mediamind asked me if I want to write a guest post on the future of banner creatives on their blog. Well, I flashed back to find the future – the old strategic approach… What came out was a headline called “Engagement creatives reloading the future”. Seeing what was happening on LinkedIn in the last months, it seems I had quite a good feeling on what the future might look like.

In the Mediamind post, I focussed on the response banner functionality of Facebook creatives and how the referential potential of social graph marketing intelligence let the personal network get engaged. One individual creates buzz just by being integrated with a linked name in one line of the graphic. So, people know your name and get dragged into campaign activity, just by curiosity, just by wanting to know why, what and how. Just by … you name it.

In the last weeks, LinkedIn came from being just another platform selling space to opening the potential for intelligent career online advertising, and leveraging the network potential with clever display advertising. Companies were focussing on personalization, the social targeting opportunities and the API potential to enable innovative campaigns creatives on the business network.

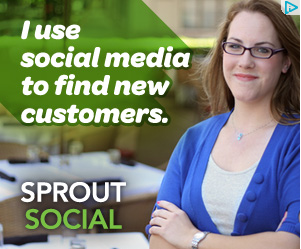
While some social media marketing companies (funny right…?! see picture above) use the traditional way of banner creatives, Volkswagen identified the evolution of the pick-a-boo effect and the competitive aspect of having more contacts, more recommendations and better education. Just the things that make up a career…

YouTube

By loading the video, you agree to YouTube's privacy policy.
Learn more

Load video

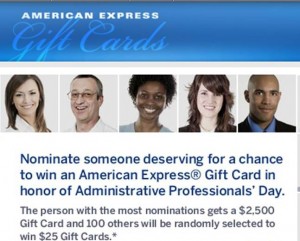
Another example is AMEX. They took their social advertising career campaign even a step further by not spoting you, but the person next to us that helps successful managers, the teams and you: the administrators. People could nominate their business supporters, and by voting promote these “second liners” to have a chance to win a gift card courtesy of 2.500 USD.

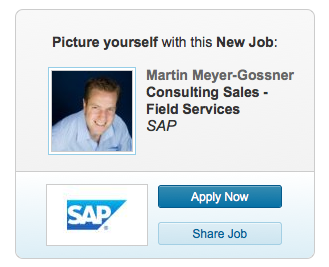
In the end, the most convincing career social display campaign is when you find yourself in the middle of a personalized creative. When I checked one of my contacts from SAP today, a rectangle banner appeared next to the SAP contact profile of the person I am linked with. Now, guess what happened? I got offered a job from SAP. Well, maybe not the job I wanted but still a great approach.

The banner was personalized using my LinkedIn picture and my name. It was really somehow talking to me. It detected I could be in the software industry, I could be a consulting sales person, and yes, the creation is clever in terms of straight interaction and sharing. Don’t you think…?

Spot On!
We are still early stages with these new (career) display advertising opportunities. Still, the advertising evolution is happening, and publishers need to have a close look at the opportunities if they don’t want to loose the battle to social networks. These examples might be geeky – however, they are engaging, personalized and conversational. Just what traditional banner cannot offer far too often…

What happens in 60 seconds on the Social Web? A comparison and the value of "infographics"…

There are different ways to illustrate how fast the Social Web is growing these days. For two years my favorite “real-time” resource -based on studies and research data- was Gary Hayes Social Media Count. And I am sure, you have all seen this great little widget already…

However, we also have to keep up with the pace and realize that -although people already hate them- infographics are sometimes a nice way to grab facts quick and easy. The Shanghai Web Designers created an infographic which illustrates how fast conversations, comments and content are produced on social networking and online platforms in only 60 seconds.

60 Seconds - Things That Happen On Internet Every Sixty Seconds
Infographic by- Shanghai Web Designers

Now, although I honor the work of the Shanghai Web Designers, it lacks some information on where the data was generated from. Gary Hayes explains nicely how the app data was put together and how actual it is (having said that I think Gary needs to refresh his links as I found links ending in 404’s).

A comparison could be interesting, I thought. Why not compare the 60 seconds data from the Shanghai Web Designers (SWD) versus a “one-minute-momentum” of Gary Hayes (GH) counter…? I started the counter and waited 60 seconds, and there you go. Here are the results…

The comparison will just focus on the essentials Google, Email, Facebook, Twitter and Youtube. You can still do your own comparison afterwards…

Google
Search queries: 694,445 (SWD) versus 1,393,519 (GH)

Emails
Emails sent: 168,000,000 (SWD) versus 204,255,455 (GH)

Facebook
Status Updates: 695,000 (SWD) versus 696,758 (GH)
Comments: 510,040 (SWD) versus 512,100 (GH)

Twitter
New accounts: 320 (SWD) versus 208 (GH)
Tweets published: 98,000 (SWD) versus 62,707 (GH)

YouTube
Hours of content uploaded: 25+ hours (SWD) verus 36 hours (GH)

LinkedIn
New members: 100 (SWD) versus 60 (GH)

Spot On!
The comparison makes clear that the Facebook figures are similar whereas for the rest of the figures there is a massive discrepancy in numbers. Facebook is sharing their latest actual figures, for the other technology platforms the data probably comes from third party sources (or at least as far as I can see). If all platform and technology owners would share their latest data, those discrepancies won’t happen. The lack of source information from Shanghai Web Designers makes it difficult to argue which data is the latest, where the differences in the comparison are coming from, and so on. Maybe this is the reason why some experts don’t like infographics any more. “Don’t like…” might be wrong when I see how many people have shared the infographic in the last days. They appear very nice and compelling in social networking accounts and “illustrate” thought-leadership in presentations. Right…?!