Tag Archive for: Content

National Geographic makes Augmented Reality go live…

The opportunities to attract peoples’ attention are increasing with the use of Augmented reality. Appshaker recently launched a fantastic way for people to interact with the world of National Geographic Channel’s content from around the globe. The set-up obviously took some budget. With the use of augmented reality, people could virtually interact with different scenes in which they were able to get in touch with dolphins, leopards, the space landings, dinosaurs and more.

The result..
1000s of people interacted with the National Geographic Channel brand in the process as it toured Hungary, with 1000s more people sharing snapshots and video on Facebook as a result.

Vimeo

By loading the video, you agree to Vimeo's privacy policy.
Learn more

Load video

Live Augmented Reality for National Geographic Channel / UPC from Appshaker Ltd on Vimeo.

Marketing automation – A sleeping lead generation star…?

Although companies get flooded with information concerning the benefits of marketing automation, the topic is still “not self-explanatory” to most marketers. The majority of B2B companies understand the general benefit in principle. Nevertheless, only a few are using marketing automation yet (7-10%). It seems that marketing automation is a sleeping star…

Still, the market for marketing automation is growing as you can figure out from the numbers below. Not surprising. The solution providersfor marketing automation proclaim an increase in lead generation and explain companies how easy it is to manage the sales lead funnel. And generating leads is what drives the B2B world around…

The annuitas Group just recently published some statistics from numerous sources that summarize the marketing automation market and published an interesting infographic.

– 110 vendors are seeling products and solutions in the marketing automation space
– 81% of best-in-class companies see the benefit in closing deals faster
– 76% of marketing decision makers see generation of high-qualified leads as the biggest challenge
– 64% of them have neither an internal nor external process to manage marketing automation
– 36% use marketing automation for lead nurturing
– 451% increase in qualified leads get businesses that use marketing automation for lead nurturing
– 47% more closed werde generated via lead nurturing generiert
– 10% use marketing automation to follow up later in the buying cycle

Spot On!
The statistics illustrate the power of marketing automation and what it could do to lead generation. However, when companies use marketing automation, only 25% use the full potential of marketing automation. It has become a “must have” in the marketing departments, at least of enterprises. If small and medium-sized companies use marketing automation or their a pre-sales/telemarketing to leverage their marketing and thus sales potential would be an eye-opening statistic in these terms. In many cases, time and resources hinder most companies from diving deeper into the potential of marketing automation and thus their brand content, the context in which it appears, and the community that talks about their business, products and services. The approach that I came across the last three years was an outsourced solution to service providers like agencies, publishers or software providers. And the main challenge of lead generation and nurturing is to align marketing, sales and customer service for a more efficient web strategy.

Would you agree that marketing automation is still a sleeping marketing star for lead generation…?

Web or App? Nielsen study knows usage time of Android smartphone users

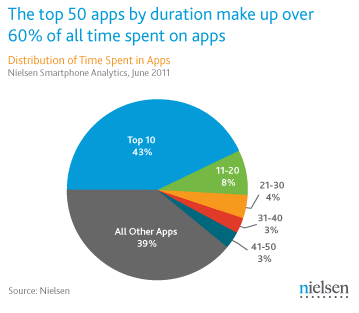
According to the latest findings of research firm Nielsen that tracks and analyses iOS and Android data, smartphone users spend twice as much time on applications than on mobile version of these websites. The study reveals also that –although there are millions of apps in the world- only “a very small proportion of apps make up the vast majority of time spent”.

The average Android smartphone user spends 56 minutes a day using apps and browsing the internet. Two-thirds of that time is usage of apps, the rest goes to mobile websites and 39% acccount for consumer app consumption. The study illustration below shows that mobile device owners spent almost half of their usage time on their top 10 favorite apps and 51% on their favorite 20 apps.

Let’s give it a guess… Probably most of the app usage of mobile device owners accounts for the following usage time: Checking email apps, Facebook, Foursquare or Gowalla, Twitter, and some of their favorite and coolest news or geeky gaming apps (very often used by their kids). And if you look at the top (free) list of apps you find Angry Birds, Angry Birds Rio, Google Maps, YouTube, Facebook Mobile, Skype, Tiny Flashlight, Viber and Drag Racing amoungst others.

The study supports my own feeling that although we continue to download apps and spend (2010 per user: Android 1,97 USD, iPhone 21,22 USD), we only use most of them them periodically, and only a few continously if the give us permanent benefit in networking or staying up-to-date on news.

Well, the time will come when HTML5 might change the market situation and developers will have an easy time working with apps. Amazon’s Kindle Cloud Reader gives insights in what is possible with HTML5 for the mobile web.

Spot On!
The study does not really give an answer to the question yet, or can give a recommendation to management. Still, Seeing these numbers, just imagine the chances companies and brands have when launching a new app to get under the hiflyer apps in the smartphone user market. Ideally, think about the five strategic reason that could make your app successful and be aware of the fact that most brand apps fail.

What happens in 60 seconds on the Social Web? A comparison and the value of "infographics"…

There are different ways to illustrate how fast the Social Web is growing these days. For two years my favorite “real-time” resource -based on studies and research data- was Gary Hayes Social Media Count. And I am sure, you have all seen this great little widget already…

However, we also have to keep up with the pace and realize that -although people already hate them- infographics are sometimes a nice way to grab facts quick and easy. The Shanghai Web Designers created an infographic which illustrates how fast conversations, comments and content are produced on social networking and online platforms in only 60 seconds.

60 Seconds - Things That Happen On Internet Every Sixty Seconds
Infographic by- Shanghai Web Designers

Now, although I honor the work of the Shanghai Web Designers, it lacks some information on where the data was generated from. Gary Hayes explains nicely how the app data was put together and how actual it is (having said that I think Gary needs to refresh his links as I found links ending in 404’s).

A comparison could be interesting, I thought. Why not compare the 60 seconds data from the Shanghai Web Designers (SWD) versus a “one-minute-momentum” of Gary Hayes (GH) counter…? I started the counter and waited 60 seconds, and there you go. Here are the results…

The comparison will just focus on the essentials Google, Email, Facebook, Twitter and Youtube. You can still do your own comparison afterwards…

Google
Search queries: 694,445 (SWD) versus 1,393,519 (GH)

Emails
Emails sent: 168,000,000 (SWD) versus 204,255,455 (GH)

Facebook
Status Updates: 695,000 (SWD) versus 696,758 (GH)
Comments: 510,040 (SWD) versus 512,100 (GH)

Twitter
New accounts: 320 (SWD) versus 208 (GH)
Tweets published: 98,000 (SWD) versus 62,707 (GH)

YouTube
Hours of content uploaded: 25+ hours (SWD) verus 36 hours (GH)

LinkedIn
New members: 100 (SWD) versus 60 (GH)

Spot On!
The comparison makes clear that the Facebook figures are similar whereas for the rest of the figures there is a massive discrepancy in numbers. Facebook is sharing their latest actual figures, for the other technology platforms the data probably comes from third party sources (or at least as far as I can see). If all platform and technology owners would share their latest data, those discrepancies won’t happen. The lack of source information from Shanghai Web Designers makes it difficult to argue which data is the latest, where the differences in the comparison are coming from, and so on. Maybe this is the reason why some experts don’t like infographics any more. “Don’t like…” might be wrong when I see how many people have shared the infographic in the last days. They appear very nice and compelling in social networking accounts and “illustrate” thought-leadership in presentations. Right…?!

What is Social Media? – Famous quotes from the istrategyconference Amsterdam

After the first day of the istrategyconference in Amsterdam, I briefly wanted to share some insights in how Twitter caught some famous quotes about “What is Social Media?”. The people who brought these quotes up in their presentations, or the people that (re-)tweeted those might forgive me if I am not quoting and linking back to every single tweet, or Twitter account where it came form.

Why I am not quoting? Apart from having to listen to Power Point presentations, the challenge for presenters and moderators is to attract the attention of a crowd. And for the audience it is becoming more and more some massive workload to do multitasking, and participating an offline event in a 2.0 manner. A thought I have explored in a German post, and definitely need to translate when I find the time for it.

“Sometimes it makes you mad to listen to speakers and keynotes, write tweets, and respond to mails and Facebook at the same time. Not to mention blogging… How do you handle this?” A question I asked my friends on Facebook today. And I know from studies that multitasking is becoming more difficult the older we get, and that we are only able to do maximum two things at the same time. I don’t know how you see this but participation 2.0 is nearly impossible if you want to be share the way people would love you to do it.

This is just a random collection of different quotes that shows how Social Media was defined at the conference. Maybe you add some more quotes…?!

“Social Media is like sand: you can play with it and have fun but sometimes it gets into your underwear and becomes very annoying.”

“Social Media is like gardening: the real hard work starts after the seeding and planting.”

“Social Media is like … a dance with the right music (content) and partner (fan). It never needs to end!”

“Social Media is like an icecream, it’s delicious, everybody wants it, but it melts if you are too slow.”

“Social Media is like teen sex. Everybody wants to do it. Nobody knows how. When it’s finally done its a surprise it’s not better.”

Spot On!
In the B2B SocialMedia panel, which I had the honor to moderate and talk to Ed Bezooijen (Citrix), Paul Dunay (Networked Insights) and Menno Lijkendijk (Milestone Marketing) I also mentioned a quote that I think is going to be the main challenge for B2B marketers in the future. The relationship of content, distribution and perception which was (and in my eyes still is) the advantage of publishers to other content producers and curators. Publishers have all three of these as main pillars of their business…

“Content = King – Context = Queen – Community = The Empire”

If you see it different, tell me. If you like it, do so. If you want to add something, go ahead…

PS: THX to a great team from istrategyconference in Amsterdam for the good organization and the diner yesterday night.

Is the future of positive social approval changing?

Almost two years ago, I have written about the development on Twitter that positive comments are not rated in a way they should (in my eyes). Those days I asked the question if the RT (Retweet) becomes a killer for the positive blog comment. Many people tapped my shoulder virtually and agreed with my observation.

In some way the RT “button” is similar to Facebook’s LIKE button. It is a given opportunity to automize a process of agreement. And I am asking myself if Facebook’s LIKE button -launched one year ago- has the same “negative influence” on our positive comment on reviews in the future. Although it was meant to give its members an easy way to show approval for products, services, content and thoughts. I am coming back to these thoughts as I stumbled upon an interesting local study.

According to a recent study released by CityGrid Media, conducted by Harris interactive, that did some research on Web properties focused on local merchants, consumers prefer the “Like” button to writing a positive review for a local business. The study polled 1,006 adults in the U.S. over the phone between March 16 and 20.

OK, this is restricted to local only. But do we doubt that there is a difference in the regional and global attitude and behavior of humans? Especially as 52% of respondents said they visited more than two websites before visiting a local business, and Google plus Facebook were the most popular first sites those people accessed.

The study states that 20% of respondents say they show support for local businesses by clicking the “Like” button for that business on Facebook versus 13% who write reviews. The offline way is still the most successful method according to the study. The verbal way of telling a friend was the most popular method (75%). Not surprising as most of the consumers are still more listening than telling.

However this is just a local research, I asking myself if this s a good development, for us, for retailers, for brands and for the Social Web in general. Bearing in mind how much our written reaction on products and services influences our buying behavior, I think, it is not good if only the negative comments get (negative) credits while positive comments and reviews just find the automated, lazy “push a button” credit – no sentiment, no conversational reward, no tapping on the shoulder virtually…

How do you see this development?

Study: 70% of Facebook and Twitter Pages from brands don't rank in Google

BrightEdge recently uncovered with a research project that social profiles of most leading brands don’t rank well in Google. Although many companies still invest a lot of their budgets in SEM/SEO activities, most of them forget to increase their social media presence from a search results perspective.

The research reviewed 200 of the world’s top brands for their social media presence. Most of the those brands, nearly 100%, stay on top or near the top ranks for their brand names on the SERP’s. However, a high percentage of 71% did not have their Facebook pages in the top 20 results. For Twitter it showed more or less the same result: 68% of the brands surveyed were not amoungst the top 20 results of the Google SERP’s.

“Brands today are pouring countless resources into social media channels and are creating great content that will help them engage with consumers, optimizing these for SEO purposes is a crucial way to drive exposure. Brands may be missing critical customer connection points if consumers can’t easily discover their social media pages in search.” Jim Yu, CEO, BrightEdge

Interestingly enough, there seems to be no necessary correlation between the number of friends and followers and SERP rankings according to the analysis of various social media pages that the BrightEdge surveyed. For example, the Facebook page of a leading photography brand did not perform in the top 20 search results, although more than 160,000 were fans of their Facebook page. On the other hand, a leading auto manufacturer with only 17,307 fans had a Facebook page that ranked in the top 10 of search results.

The least effective brands at optimizing Social Networking sites are coming from the finance and insurance sector. Only three of the top 43 companies had their Facebook pages rank in the top 20 search results. In comparison, retailers were much more successful: 13 out of the top 23 retailers surveyed were found in the top 20 search results.

Spot On!
Brands could argue it is more important to find your homepage or branded pages for products or services in the top search results. Social Media experts might see this different as some of the main brands invest a lot of their branding activities in the leading Social Media sites at the moment. Especially, under the aspect from last year’s report that some big brands reported to loose their traffic on corporate websites to Facebook, the search impact for brands might become more and more important in the future. Would you agree?

News Update – Best of the Day

Some day sago, I have written about the changing atmosphere since social media monitoring companies are moving into the CRM sector. Andrew Hunt discusses the issue if “Sales is killing Social Media?” and explains how B2B sales is changing from both sides: Customer are at least “spectators” according to a Forrester study. The question is when companies are changing their sales process to a “listen and engage” model for the old “speak and push” format, where he refers to an interesting insight from OgilvyOne about the future of selling.
A recent Penn State research claims that updates on Twitter, Facebook, LinkedIn and other real-time content sites could be worth more than 30 million USD a day, or nearly 10.9 billion dollars a year, to advertisers. The study was based on separating duplicate searches from unique search terms. Then, the research determined the value of the real-time search terms by using Google Adwords Traffic Estimator.

Start the day with a smile and don’t invest in the wrong portfolio… Nice commercial from Invesco.

YouTube

By loading the video, you agree to YouTube's privacy policy.
Learn more

Load video

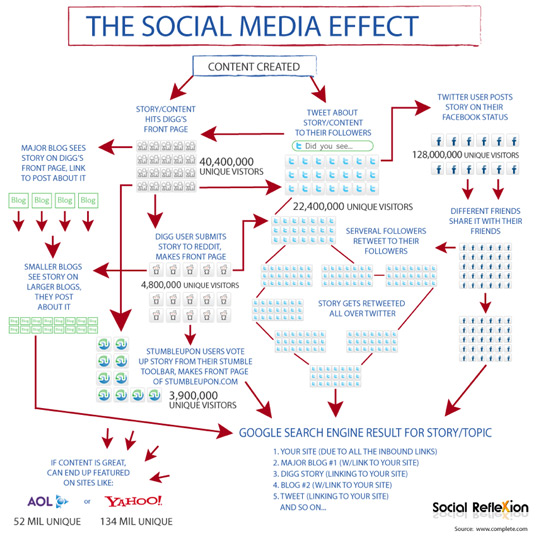
The Social Media Effect (Infographic)

At the moment, it is cool for companies to create their own infographic. Every day, there are many of those in my timeline and becomes harder to track what is good and what is for the bin. This visualization from InfographicWorld explains nice and easy the process of sharing that pushes people to a snowball effect and makes them spread your piece of content.