The team of WestJet made a Christmas afford to bring some Toronto passengers a personalized gift at their destination. With an interesting technology approach, they made some wishes becomes reality…like miracles really do happen. I have to admit that the campaign massively reminded me of the former KLM Surprise campaign but still the marketing budget is wisely spend when you can make people share their happiness around Xmas. Do you like it?
By loading the video, you agree to YouTube's privacy policy. Learn more
Does mobile technology really have “more influence on global change than countries, governments or corporations”? Well, at least if we can believe in the 50% of respondents of a new European research by CNBC called “Europe’s Mobile Elite 2013”. The study states that Europe’s business elite continue to embrace the latest smartphones, tablets and devices. In general, most European business executives (73%) believe that they are keeping up with technology change within their sector, however almost less than four in ten are not confident with their companies’ technology change.
The study shows that most business leaders own a mobile device (90%), live and like the mobile business and are agreeing that life is “easier” (68%). Even more, 64% see their lives becoming more productive and enjoyable. Apple is still leading with 44% owning an iPhone versus Android users with 35%. Obviously tablets are on the rise as well with almost. The merging worlds of private and business becomes clear with the fact that 72% (up 39% from 2011) use their tablets for both work and leisure.
Not surprisingly, two thirds value tablets “useful business tools”. Also second screen usage is big among the business elite: 75% watch TV at the same time as using their tablet. The engagement effect of the tablet is striking with nine in 10 of these consumers taking some form of action on their tablet as a result of seeing TV content. And when the study shows that a third of the business executives are responding to TV advertising, marketers should think about ow to implement clever brand and lead generation campaigns in their TV spots. And when marketers want to reach the business elite, they are best in sending out their messages in the evening and at weekends (tablet usage). Smartphones are always-on, so no special advice here.
“This study shows the huge influence mobile technology has on our lives. Europe’s elite are keeping up with technological change, owning more devices than ever and using each in different ways. In the area of social media and its value in business, the jury is still out and it will be interesting to see where this leads next year.” Mike Jeanes, Director of Research, EMEA, CNBC.
Top content for tablets…
– business and financial information (72%)
– web browsing (70%)
– news updates (70%)
– email (69%)
– reading newspapers/magazines (69%).
Top content for mobiles…
– email (79%)
– business and finance (72%)
– web browsing (70%)
– news updates (70%)
– GPS (69%)
Spot On!
Despite some common disagreement that the business elite is not on social networks, the study makes clear that 85% are a member of at least one network with 61% on Facebook, 58% on LinkedIn, and 43% on Twitter. It is important to note that 40% (up from 19% in 2011) of Facebook, LinkedIn and Twitter users are now connected to all three social networks. Furthermore, 58% of the business decision makers use social media for business (still private use is the standard for 75%). It could be that private and business worlds are really not kept as separate any longer. The commercial impact of social media is seen critical. When 46% see social media “neither useful nor essential” (compare study 2012), it shows that most business decision makers had either the wrong advice or the wrong expectation raised by consultants. One of the reasons why we are always very critical in analyzing the benefit of social media for a company or brand, and trying to show the realistic benefit for companies.
https://thestrategyweb.com/wp-content/uploads/2017/11/strategywebLogo-300x139.png00The Strategy Webhttps://thestrategyweb.com/wp-content/uploads/2017/11/strategywebLogo-300x139.pngThe Strategy Web2013-12-03 11:51:072013-12-03 11:51:07Study: Business Elite increasingly embraces mobile technology
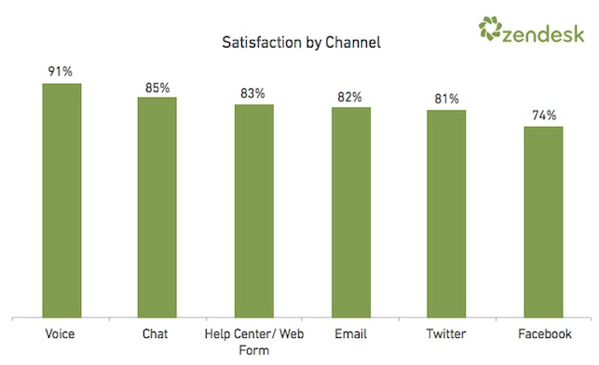
In an interesting report by Zendesk across the globe, it becomes obvious that telephone is still the preferred way to the customer service of companies. The report shows insights based on actual customer service and support interactions from over 16,000 companies across 125 countries.
According to the Zendesk report, customer all over the world were most satisfied with customer support they received on the telephone. The insights done in Q3 2013 show that 91% of customers liked the way they got help on the phone. In the second place of the satisfaction ranking came Chat (85%), followed by Help Centers/Web Forums (83%). On the social networks side Twitter (81%) came in before Facebook (74%).
Not surprisingly, the report also made clear that during normal business hours the support got the slowest first reply times (FRT) plus the lowest satisfaction scores. In the time period between 5-6pm local time -often when the service teams change or leave business for the day- companies have got the longest FRTs.
Interesting to see that Brasil and Canada received the highest customer satisfaction scores although there was no real indications on what the reasons could be. United Kingdom finished in position 6, US in 11 and Germany only in 14. From an industry perspective, the IT services and consultancy business, government and education achieved the highest customer satisfaction rankings.
Spot On!
Companies would be clever to combine these findings with their customer churn and growth rates to see the impact of customer servcie on the development of their customer base. Although many companies do custoemr servcie via Twitter and Facebook, which is steadily growing and improving since 2012 according to the report, we have experienced that social media in customer service if often just used to calm people down and get them engaged in a phone call to solve their issues. A trend that has shown the best customer service satisfaction results.
https://thestrategyweb.com/wp-content/uploads/2017/11/strategywebLogo-300x139.png00The Strategy Webhttps://thestrategyweb.com/wp-content/uploads/2017/11/strategywebLogo-300x139.pngThe Strategy Web2013-11-28 16:44:522013-11-28 16:44:52Customer Service Report: Phone support still top, Twitter comes before Facebook
The latest British Airways #LookUp billboards at Piccadilly Circus are claiming to be interactive and tell those passing by which BA flight plane number it is that is flying over our heads. The advertising creative gets triggered when a plane flying over the ClearChannel digital outdoor sites through the Heathrow flight path. It then tells people passing by real-time data of the plane’s destination and flight number. The funny thing: It also provides a weather feed that reads the cloud height to make sure people see the plane before the advert gets shown to them. Just imagine what you could also do with that idea in terms of promotions: Provide weather information on the take off destination, add some nice hotel advert or a restaurant recommendation with it, and so on. Cool campaign, right?
By loading the video, you agree to YouTube's privacy policy. Learn more
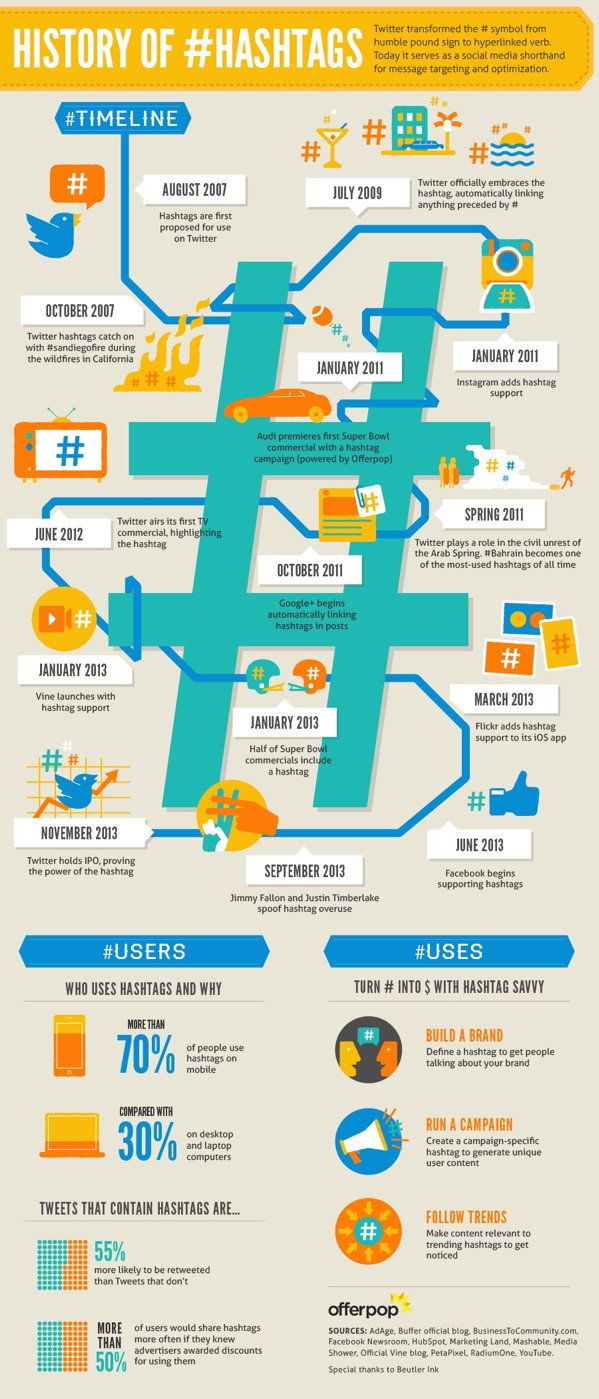
Whether you use hashtags “#” or not, they have made their history since first introduced in 2007 by Twitter. They became the filter, not only for Twitter – also for special topics, for branding, for trends, and for what not.
Although many people ignored hashtags from the beginning on the social platform, they find more and more acceptance today, now that people know why they are in the world of social web communication. Their real increase in use cam with the year 2009, when the 140 character network decided automatically linking anything preceded by the pound sign.
Nowadays, if you want to get retweets, you better use hashtags as these tweets are 55% more likely to be shared than those without any #. Even Google+, Facebook, Instagram or Vine have started to accept the hashtag value. And Offerpop now introduced an interesting infographic which shows the history of the hashtag.
PS: Interesting to see that more people use hashtags on their mobiles than on their laptops or desktops. Mobile information is consumed in short time periods, so you better make sure people grab your information when they jump on the bus, the train or at a break at an event. Hashtags are the access keys!
https://thestrategyweb.com/wp-content/uploads/2017/11/strategywebLogo-300x139.png00The Strategy Webhttps://thestrategyweb.com/wp-content/uploads/2017/11/strategywebLogo-300x139.pngThe Strategy Web2013-11-20 19:01:202013-11-20 19:01:20History of Hashtags (Infographic)
Human interaction gets disrupted by new technologies like smartphones and tablets. Yet, we are still trying to figure out and learning how to engage with our mobile devices when other people are around. Time to rethink (mobile) etiquette. When is it ok to check our mails on our phones? At dinner with friends or during a conversation in a restaurant? There is no golden rule these days, and many people might define their own etiquette.
A recent infographic gives some mobile advice with some new etiquette ideas. The infographic by Deals.ebay.com is based on some studies which show some insights in mobile users opinions. The younger generation age 18-24 have obviously a quite relaxed understanding on how and when to use mobiles: 50% of GenY think texting is allowed during meals – compared to just 15% of people aged 30 and older.
PS: One term was even new to me: Phubbing -a short version of phone-snubbing. But, check it out yourself – and if you got some advice, start the conversation.
Via deals.ebay.com
https://thestrategyweb.com/wp-content/uploads/2017/11/strategywebLogo-300x139.png00The Strategy Webhttps://thestrategyweb.com/wp-content/uploads/2017/11/strategywebLogo-300x139.pngThe Strategy Web2013-11-19 07:45:182013-11-19 07:45:18The evolution of the mobile etiquette (Infographic)
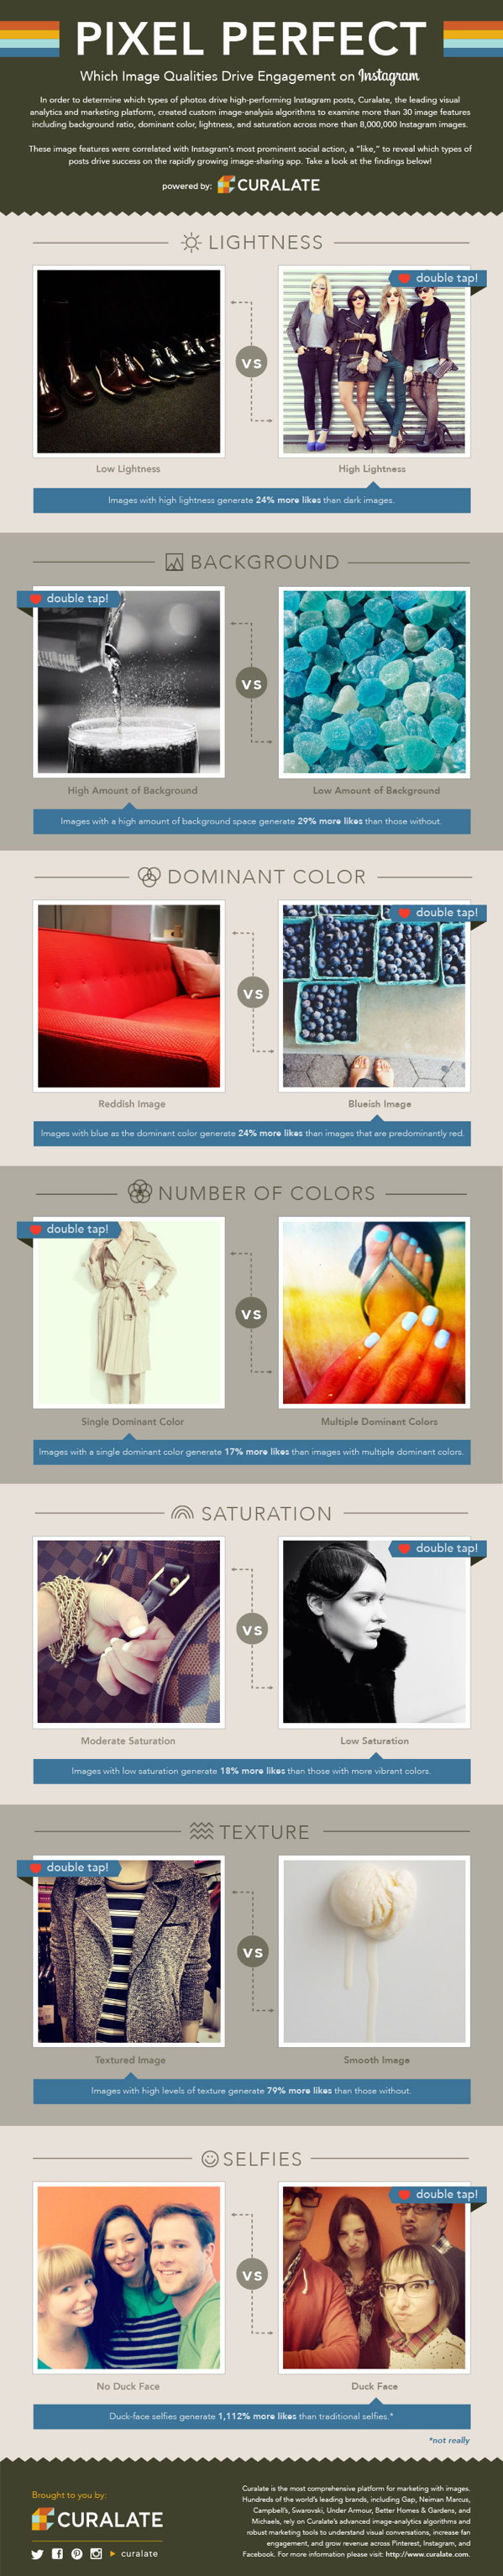
The Philadelphia-based viaul analytics and marketing company, Curalate, states it created algorithms to figure out how more than 30 picture features, like color, lightness or saturation, might effect your Instagram success. To generate these insights, the specialists analyzed over 8 million images from the mobile photo-sharing network. I am assuming this also counts for Instagram’s competitors like Pinterest (if not then Curalate needs to provide some proof please).
Some key findings…
– Photos with a high volume of blues and other cool colors seem to generate more likes than photos with warm red and orange.
– Dominant single colors in images are also more successful. Pictures with clear single hue generate 40% likes than others.
– Less color wins. Don’t flood your pictures with too many flashy and vibrant colors. Less saturated images generate 18% more likes than wild and vibrant ones.
https://thestrategyweb.com/wp-content/uploads/2017/11/strategywebLogo-300x139.png00The Strategy Webhttps://thestrategyweb.com/wp-content/uploads/2017/11/strategywebLogo-300x139.pngThe Strategy Web2013-11-14 07:38:592013-11-14 07:38:59Success: How picturess get more engagement on Instagram
Some years ago, I have written about the Retweet button being the “killer of positive blog comments”. Over the years in many seminars and speeches, I have stressed the point that the ROI of the social web is not about generating high quantity in “thumbs up” on Facebook or Retweets on Twitter, or anything automated that comes along with similar meaning.
Retweets, Repins & Co. are only of value for your business, if…
– you accept those automated response generators as the pillars of your ROI system.
– you are a marketer who builds their business on proving the capability of accelerating reach rather than relevance.
– you are a brand that struggles to understood the value of building a community-centric business.
Still: Are ratings as insightful as a written comment – be it on Twitter, Facebook, LinkedIn or any other community platform out there in the social web?
Yesterday, it became public through a post on TechCrunch that Facebook is testing out a system of openly displaying star-ratings on Pages. Will this be another killer of value creation?
I definitely agree that the Facebook “Like” has become confusing, and in some way worthless. Many users just click on the Like button out of a pure and immediate emotion, nothing sustainable, lasting or resilient. Some are expressing their solidarity with it. Some are missing the dislike button, and click the Like button.
Do those automated responses tell us what they really feel? Do they tell us what people really think? Do they help us to evaluate our position? Fair enough, these automated response creators are some word-of-mouth catalysts. Well, I admit by adding these five star ratings, there is at least some specification in the differentiation of generating feedback.
Obviously, the new rating system puts Facebook in a different position and moves it more to the likes of Foursquare, Yelp and traditional trend shop systems. Furthermore, it allows users to be more concrete in defining their opinions. Users might get better orientation in why a coffee shop or a business or restaurant deserves to be tested.
Spotted by TechCrunch
But does it really help us? What is a 4.2 with twelve votes compared to a 4.9 what two people have build up? Do we know who gave the votings, and if these people have the same interest and preferences that we have got? Doesn’t orientation get even more confusing? What will we book on travel websites when there are less and less reviews and recommendations?
Spot On!
The 3 Rs of the social customer (ratings, reviews and recommendations) might make our lives interesting and exciting for new stuff. But maybe there is too much new trends and products out there to get our heads around. Maybe a real review or recommendation will sometimes help (one positive and one negative like Amazon does it already). Still, automated feedbacks -be it stars, RTs, Likes, etc.- are the least valuable insight creation generators on a relevance scale that helps defining internal and external social web ROI.
PS: If your managers are still happy when your numbers of Likes go up, be happy and tell them nothing about this post. If not, let’s discuss further how social networks should constitute in order to deliver deeper insights in the mindset of our customers.
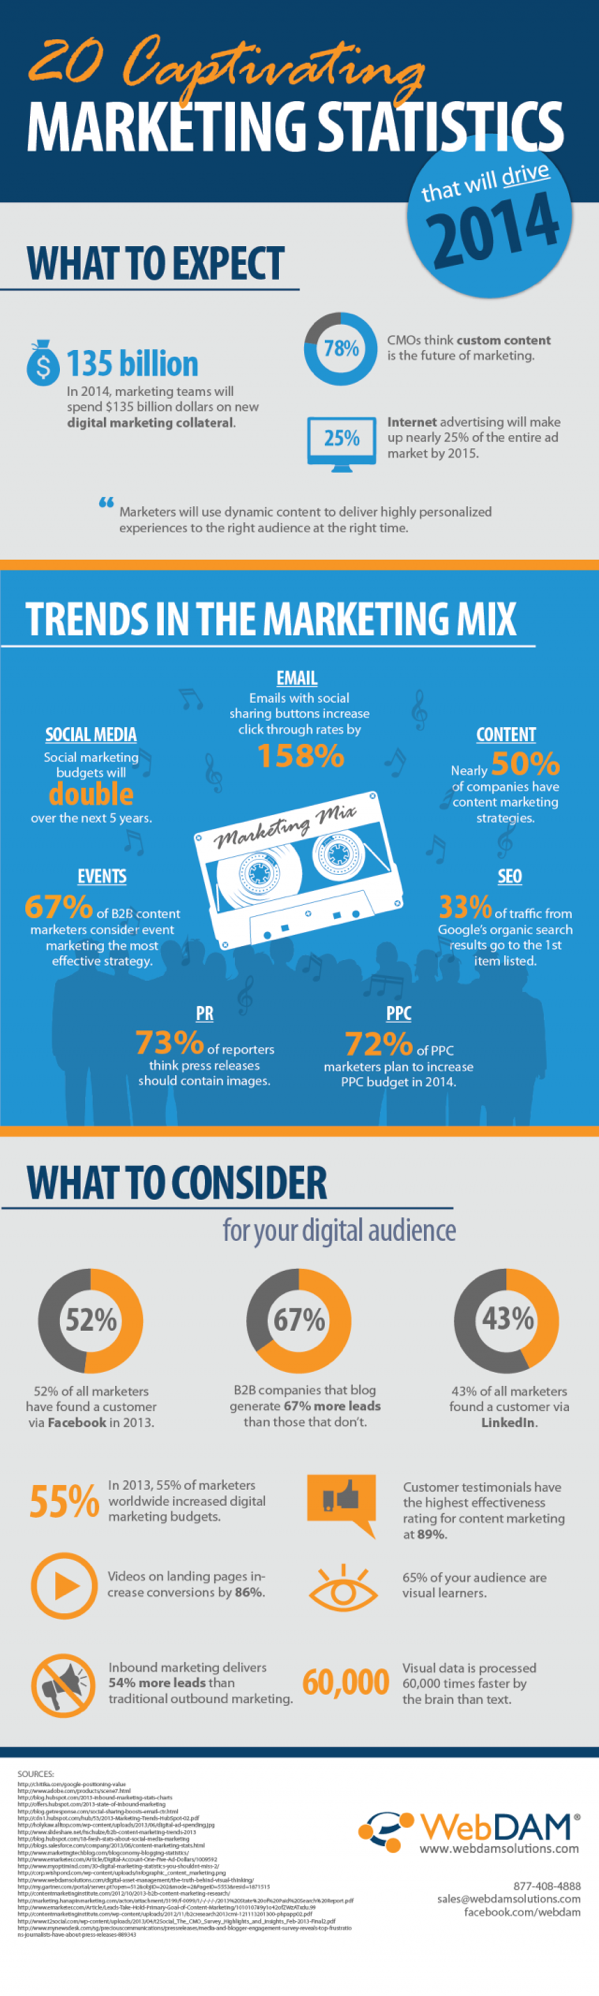
The time is now. When Q4 is heading towards December many companies, analysts, experts and specialists start their forecasting for the next year, and what will drive the business. So, what happens in 2014? The first infographic just came out by the guys of WebDAM. The company provides a digital asset management software and just recently aggregated some interesting data in order to illustrate 20 key trends for marketers which will become important to meet the demand of their own business targets.
Five key findings in brief that we think companies should watch out for…
– Email with social sharing increases click-through rates by more than 150%
– CPM is out: Pay Per Click budgets will increase to over 70%
– More than 50% of marketers found customers on Facebook (40% LinkedIn)
– Video landing pages increase conversions by almost 90%
– Client testimonials are most effective as content marketing format
Managers around me get confused about the trend content marketing. What exactly is, and where does it start? A promoted tweet? A long branded status update? An advertorial? Promoted or sponsored content? A commercial that does story-telling? I have decided to discuss this a bit when I came across a great commercial yesterday as Pepsi turns the tables these days again.
But let’s start with another commercial that AUDI launched at Super Bowl this year called “Prom”. Watch it first, so you know what we are talking about. Cool commercial. Nice story. Well thought. No doubt…
By loading the video, you agree to YouTube's privacy policy. Learn more
Many digital experts defined this in posts or in their presentations at marketing events as content marketing. Somehow, they might have been right as it is telling a story with a beginning, a turning point and an end. And it is not just a well-produced commercial highlighting a product. It is not focused not on pure selling or promoting it.
Former commercials from Volkswagen “Star Wars”, Old Spice’s “The Man Your Man Could Smell Like” or Blendtec’s ongoing series of product tests on Youtube already went towards the content marketing direction. In their line of mention, they were evolving from a traditional commercial into some form of viral advertising series. These clearly differed from the AUDI commercial as their story-telling was neither epic, nor f(r)iction.
Now, Pepsi comes up with some really clever advertising approach in my eyes. And the question I would like to raise is: Is this content marketing or story advertising?
Most of us have seen the movie “Blues Brothers”. In that film, Elwood must reunite the old band and go on another “Mission from God”. Based on that plot, the Pepsi MAX commercial series gets their food.
After introducing Uncle Drew in the first commercial, the second series starts with a conversation between Uncle Drew and basket ball legend Bill Russell (well played by Morgan Freeman) who sends him on a mission “Get out there and get your team together again!” He shall teach the young boys how to “get buckets” – the claim of the series.
First Commercial
By loading the video, you agree to YouTube's privacy policy. Learn more
The third commercial just recently came out and takes this form of story advertising to another level. Uncle Drew visits an underground jazz club in downtown Chicago to convince his old point guard “Lights” to re-live their glory days on the court. Although his wife disagrees, he gets his friend to go out again. What happens thereafter? Just watch it…
By loading the video, you agree to YouTube's privacy policy. Learn more
Obviously, players and spectators at the basketball courts in all three versions were told that they would be filmed for a “basketball documentary”. However, they enjoyed some special show of basketball magic by Kyrie Irving.
Spot On!
Story advertising could become a new form of content marketing. Pepsi MAX doesn’t even play a supporting actor in these films. It is a series around a brand, but the brand is not the star. It is there but just doing what it’s meant to do: Max taste – sugar-free. Pure enjoyment. By creating a series of commercials with main characters coming back, a real plot around a team reunion, and some really extraordinary testimonials doing what they can do best, consumers feel like being somewhere between the movies and the sports stadium. Illusions made real. They will be waiting for the next part to come out, and hope they become part of it. It’s branded content but not in a traditional way. It is like “24” or “Mad Men”, just in the commercials. It creates excitement for the next version, engages the audience to talk about basket ball (the sports that Pepsi MAX spends their marketing bucks “buckets” on), and will become viral. This is a new dimension. This is what I would call: Story Advertising.
PS: Maybe they could have left it open until the last version when the team is together again, how Pepsi did this human transition. But that is my view, how about yours…?
https://thestrategyweb.com/wp-content/uploads/2017/11/strategywebLogo-300x139.png00The Strategy Webhttps://thestrategyweb.com/wp-content/uploads/2017/11/strategywebLogo-300x139.pngThe Strategy Web2013-10-31 01:25:432013-10-31 01:25:43From Content Marketing to Story Advertising?!


 Some years ago, I have written about the Retweet button being the