Tag Archive for: YouTube

Google Zeitgeist and YouTube Review 2012

Each year Google Zeitgeist reminds us from a search perspective what happend in the last 12 months. And this year again, we get their point of view of 2012. So, no more words. Just watch it…

YouTube

By loading the video, you agree to YouTube's privacy policy.
Learn more

Load video

Well, hang-on! Don’t forget to watch Google’s official YouTube review “Rewind YouTube Style 2012” as well. Are we surprised that it is representing the Gangnam Style “Call me Maybe”, and is including web stars like Felica Day and the viral success of Kony 2012, or the Walk Off the Earth?

YouTube

By loading the video, you agree to YouTube's privacy policy.
Learn more

Load video

Study: Largest global corporates get over 10 million mentions a month; Twitter rocks, YouTube grows massively

Companies in the Fortune Global 100 get a total of 10,400,132 online mentions in a month. Twitter is the catalyst for them as it generates the majority of these mentions. However, YouTube is the rising star this year. This is the main findings of the third annual Burson-Marsteller Global Social Media Check-Up, which also includes new data provided by Visible Technologies.

The study states that the majority of the big corporates (87%) are using at least one of the major social platforms. The main growth can be seen at YouTube with 79% of companies now using a branded YouTube channel (57% in 2011). The average performance figures showed more than two million views and 1,669 subscribers. The development is illustrating the importance of integrating original multimedia content that can be shared on the social networks.

Twitter is still the rock-star among the popular social networks in terms of corporate usage. 82% of Fortune Global 100 companies have at least one Twitter account with an average mention of 55,970 times on the 140 character platform. The importance of Twitter ca be seen in the fact that stakeholders are following global companies closely.

Compared to 2011, the average number of followers per corporate Twitter account almost tripled to 14,709 from 5,076. On Facebook, the average number of likes per company page has increased by 275% in two years to 152,646 likes this year.

“People want to interact and connect with these major companies, and these platforms are the bridge directly to the heart of these organizations. What’s even more impressive is how much companies are engaging back with followers. Seventy-nine percent of corporate accounts attempt to engage on Twitter with retweets and @-mentions, and 70 percent of corporate Facebook pages are responding to comments on their walls and timelines.”
Burson-Marsteller, Chief Global Digital Strategist, Dallas Lawrence

Some more findings of the study…

– Fortune Global 100 companies have an average of accounts of: 10.4 Facebook pages, 10.1 Twitter accounts, 8.1 YouTube channels, 2.6 Google Plus pages and 2.0 Pinterest accounts.
– 74% of companies have a Facebook page
– 93% of corporate Facebook get weekly updates
– 48% have joined Google Plus
– 25% are on Pinterest

And whatever else you might want to know about the Top Global 100 you can find here, or within their infographic….

Tuesday generates highest engagement for social campaigns

Did you not ever want to know what the best day for a Social Media marketing campaign could be? Well, you can get some good indication with the following study…

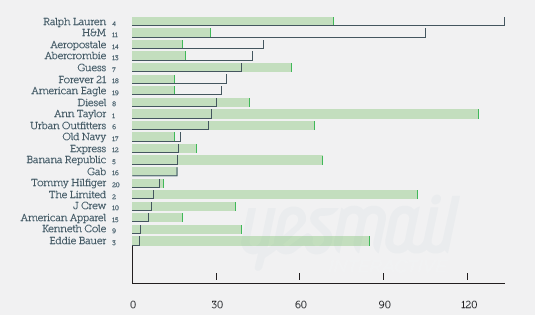
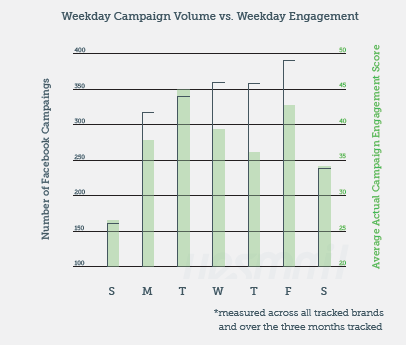
Many Facebook campaigns go live on Fridays. However, the day that generates most user engagement for a campaign on the social network is the Tuesday, which ranked only fourth in terms of the number campaigns conducted. These are some of the findings of a recent study done by Yesmail Interactive. The results are based on a three-month study of consumer engagement with online campaigns for 20 major retails brands, including Abercrombie & Fitch, Gap, or Ralph Lauren among others.

The study with the title “Using Digital Market Intelligence to Drive Multi–Channel Success” figured out the customer engagement of campaigns on the most popular social networks. In order to understand campaign engagement, it compared the relationship between “volume-based engagement” of Facebook campaigns (number of “likes” or comments a campaign generates) and “actual engagement analysis”. The finding is quite obvious, in that the lower the brand “likes”, the fewer likes and comments a brand on Facebook gets. Still, independent of the size of their fan base, some retail brands generate higher engagement levels than others through Facebook. Nevertheless, average-performing brands still performed as engagement winners, including i.e. Ann Taylor, Eddie Bauer or Kenneth Cole. 

Although, we have already reported that a balanced frequency in posting status updates is important for the success of a Facebook campaign, there is no blueprint and guarantee for success. The most engaging brands had deployed between 20 and 32 campaigns per month. Compared to the five least engaging brands with 54 campaigns per month, it becomes obvious that posting less frequently is better. From a timing perspective, the best Facebook engagement was generated for campaigns launching between 10 pm and 12 am Eastern time (EST) which was also the least-used deployment time slot.

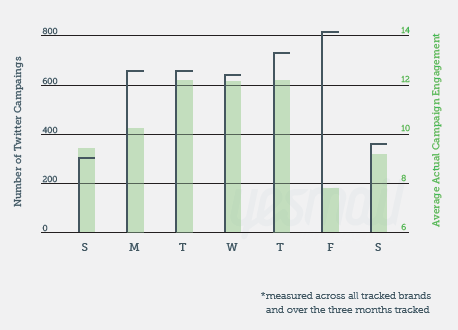
For Twitter, the research showed that most Twitter campaigns (20%) were conducted on Friday, which again is the least engaging day for such campaigns. Almost on the same engagement level performed Tuesday, Wednesday, and Thursday as those most engaging campaign days. Over 84% of all Twitter campaigns were deployed within regular work hours (between 9am and 7pm EST).

The performance of the 20 retail brands on Twitter showed big differences. Although Forever 21 came in first in terms of follower base, the brand’s campaigns showed significantly lower engagement among followers than the campaigns of brands with smaller follower bases.

The five most engaging brands did 45 to 70 Twitter campaigns per month on Twitter versus the five least engaging brands with an average number between 95 and 115 Twitter campaigns per month. It shows again that lower frequency is better than big blast promotions. If marketers want to generate high engagement, they should place their campaigns between 5 am to 6 am and 7 am to 8 am EST.

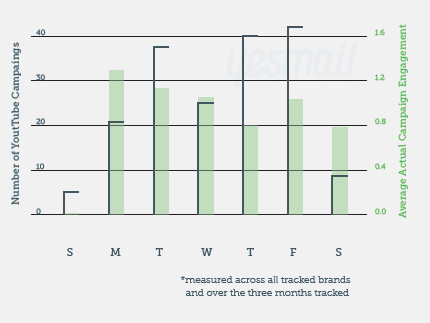
In terms of YouTube campaigns, the study found that 85% of the brands studied have a YouTube channel. Still, just 35% deployed campaigns during the research period. Some more findings indicate that on average, retailers conducted 3.5 campaigns per month during the study. The best day for interaction occurred to be Monday. Do we have to mention that this was the least likely day for campaign deployment? YouTube campaigns deployed between 2 am-3 am EST found the highest engagement rates.

The study is based on campaigns conducted from January to March, 2012 via Yesmail Market Intelligence. The selection of brands focusses on 18-35 year-olds as of their digital communication interest.

How Mobile Marketing and B2B work together (video)

We have already shared some information on a Google and Compete study that shows why B2B and mobile have a close connection. And the most relevant information from a mobile point of view can be taken from eMarketer graphic.

The importance of mobile for B2B is partly as business decision makers are frequent travelers, thus most connected business people, and partly as smartphones and tablets have given them a new freedom. And today, we also know from CNBC research that executives in Europe see the increasing value of being engaged on Twitter. B2B managers can and have their conversations anytime-anywhere from their devices.

But what is the marketing potential it offers for companies then?

As business decision makers by their definition have to be fast in their decision making process, today’s professionals need to be connected, informed, and productive wherever they are traveling, or whenever they are in meetings. As of that mobile devices give B2B marketing new opportunities to open up new relationships if using apps, QR codes or video in an intelligent way.

In her YouTube channel, on Twitter and in her blog) Christina CK Kerley shares her knowledge on mobile B2B strategies alongside some good cases. Her latest video gives some insight in how B2B marketers can use mobile to connect the offline and the online world in order to leverage B2B printed ads, to integrate the customers’ voice into video, or to bolster B2B thought-leadership content through images, video and text.

YouTube

By loading the video, you agree to YouTube's privacy policy.
Learn more

Load video

Web or App? Nielsen study knows usage time of Android smartphone users

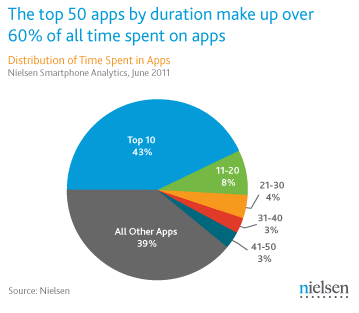
According to the latest findings of research firm Nielsen that tracks and analyses iOS and Android data, smartphone users spend twice as much time on applications than on mobile version of these websites. The study reveals also that –although there are millions of apps in the world- only “a very small proportion of apps make up the vast majority of time spent”.

The average Android smartphone user spends 56 minutes a day using apps and browsing the internet. Two-thirds of that time is usage of apps, the rest goes to mobile websites and 39% acccount for consumer app consumption. The study illustration below shows that mobile device owners spent almost half of their usage time on their top 10 favorite apps and 51% on their favorite 20 apps.

Let’s give it a guess… Probably most of the app usage of mobile device owners accounts for the following usage time: Checking email apps, Facebook, Foursquare or Gowalla, Twitter, and some of their favorite and coolest news or geeky gaming apps (very often used by their kids). And if you look at the top (free) list of apps you find Angry Birds, Angry Birds Rio, Google Maps, YouTube, Facebook Mobile, Skype, Tiny Flashlight, Viber and Drag Racing amoungst others.

The study supports my own feeling that although we continue to download apps and spend (2010 per user: Android 1,97 USD, iPhone 21,22 USD), we only use most of them them periodically, and only a few continously if the give us permanent benefit in networking or staying up-to-date on news.

Well, the time will come when HTML5 might change the market situation and developers will have an easy time working with apps. Amazon’s Kindle Cloud Reader gives insights in what is possible with HTML5 for the mobile web.

Spot On!
The study does not really give an answer to the question yet, or can give a recommendation to management. Still, Seeing these numbers, just imagine the chances companies and brands have when launching a new app to get under the hiflyer apps in the smartphone user market. Ideally, think about the five strategic reason that could make your app successful and be aware of the fact that most brand apps fail.

Social Media Evolution at EMC (Video)

Many companies have started showing case studies, infographics, or videos to present their latest Social Media activities. Now, EMC comes up with a great video that explains nicely how the copany leverages the power of the social web.

In a “comic-style” video a Neanderthal man (what a nice metaphor) explains how Social Media has changed the way EMC engages with its audiences, how it helps to strengthen their relationships with customers and partners, and the public. However great all their success might be, they also highlight the responsibility which comes along with the Social Web engagement.

The EMCCorp YouTube channel states that the “brief training video is designed to communicate the key points of proper social engagement while not losing sight of the ‘fun’ side of Social Media”.

I remember a social media training day I have given their marketing team about one year ago and how much they liked the power of virals I have shown them. Don’t know if this can be connected to the training, but I have to ask… Isn’t this a nice way to illustrate the social media evolution in the business arena? Well done, EMC!

PS: Some bits and pieces in the video could be discussed from a social media strategic perspective as I would not always agree with them…

YouTube

By loading the video, you agree to YouTube's privacy policy.
Learn more

Load video

What happens in 60 seconds on the Social Web? A comparison and the value of "infographics"…

There are different ways to illustrate how fast the Social Web is growing these days. For two years my favorite “real-time” resource -based on studies and research data- was Gary Hayes Social Media Count. And I am sure, you have all seen this great little widget already…

However, we also have to keep up with the pace and realize that -although people already hate them- infographics are sometimes a nice way to grab facts quick and easy. The Shanghai Web Designers created an infographic which illustrates how fast conversations, comments and content are produced on social networking and online platforms in only 60 seconds.

60 Seconds - Things That Happen On Internet Every Sixty Seconds
Infographic by- Shanghai Web Designers

Now, although I honor the work of the Shanghai Web Designers, it lacks some information on where the data was generated from. Gary Hayes explains nicely how the app data was put together and how actual it is (having said that I think Gary needs to refresh his links as I found links ending in 404’s).

A comparison could be interesting, I thought. Why not compare the 60 seconds data from the Shanghai Web Designers (SWD) versus a “one-minute-momentum” of Gary Hayes (GH) counter…? I started the counter and waited 60 seconds, and there you go. Here are the results…

The comparison will just focus on the essentials Google, Email, Facebook, Twitter and Youtube. You can still do your own comparison afterwards…

Google
Search queries: 694,445 (SWD) versus 1,393,519 (GH)

Emails
Emails sent: 168,000,000 (SWD) versus 204,255,455 (GH)

Facebook
Status Updates: 695,000 (SWD) versus 696,758 (GH)
Comments: 510,040 (SWD) versus 512,100 (GH)

Twitter
New accounts: 320 (SWD) versus 208 (GH)
Tweets published: 98,000 (SWD) versus 62,707 (GH)

YouTube
Hours of content uploaded: 25+ hours (SWD) verus 36 hours (GH)

LinkedIn
New members: 100 (SWD) versus 60 (GH)

Spot On!
The comparison makes clear that the Facebook figures are similar whereas for the rest of the figures there is a massive discrepancy in numbers. Facebook is sharing their latest actual figures, for the other technology platforms the data probably comes from third party sources (or at least as far as I can see). If all platform and technology owners would share their latest data, those discrepancies won’t happen. The lack of source information from Shanghai Web Designers makes it difficult to argue which data is the latest, where the differences in the comparison are coming from, and so on. Maybe this is the reason why some experts don’t like infographics any more. “Don’t like…” might be wrong when I see how many people have shared the infographic in the last days. They appear very nice and compelling in social networking accounts and “illustrate” thought-leadership in presentations. Right…?!

82% of word of mouth conversations are face-to-face

The word of mouth and research company Keller Fay Group and Google have collaborated to understand the effects of the Internet and Internet enabled devices on word of mouth conversations about brands – and the Google Business Youtube channel published some findings now in a video.

In the US there are 2.4 billion conversations involving brands on a day, and the question is what role do various types of media play in this process? The study -based on 3.000 responding adults- comes to the conclusion that the vast majority of word of mouth conversations still happens face-to-face (82%).

However, the internet is the leading source of information motivating conversations. TV is already number two media to trigger word of mouth conversations. Google searches directly inform 146 million brand conversations a day, says the video. Are we surprised? Well, I wasn’t…

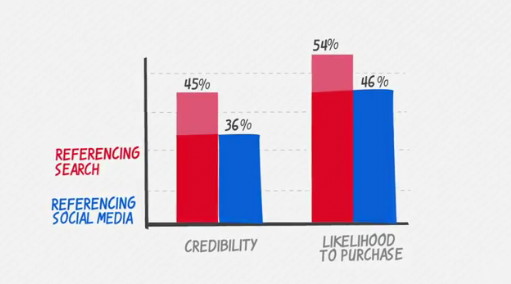
Obviously, Google would not publish it, if search wasn’t the main initiator in conversations as the study claims. According to the study, search is also said to outperform social media when it comes to credibility and likelihood to purchase decisions.

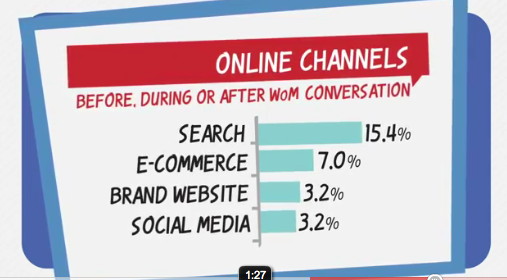
The study video concludes to mention the importance of search which is the leading source that inspires and informs, and thus triggers word of mouth brand conversations, followed by e-commerce with 7%. Social Media and branded websites are coming in at the same level.

Spot On!
The findings illustrate the importance to connect offline and online brand activities. Although search definitely has a major impact on our purchase behavior these days, and especially Google with all their opportunities and different service offerings, I would definitely stress that brand advocates also have a major impact on word of mouth conversations when using them to empower social media capabilities. The study did not use these special people as “online channels” of course. However, think about brand advocates and how you could leverage your brand with them.

PS: The full video can be seen here…

YouTube

By loading the video, you agree to YouTube's privacy policy.
Learn more

Load video

Study: Search and Social amplify purchase decisions

One thing leads to another. Today we could transfer this quote to: One search leads to another social activity, and vice versa. And this interconnection of web-strategy tactics amplifies the user’s purchase decisions.

A new study from GroupM and comScore states that 40% of consumers who search for products to purchase are taking a social activity as a next step to finalize their buying decision. And the activity can be seen from the other direction as well: 46% of consumers who use social media are searching for products to expand the basis on a product range to take a decision.

58% of users begin their journey to purchase with search. Company websites come in at 24% and social media by 18%. The opinion of “friends” on the purchase decision is highly rated in social networks and cannot be underestimated these days from brands and retailers any longer.

The study reveals interesting insights in the time period that make the essential change in the buying decision process. The “late kick” comes 30 days prior to purchase when brands and companies have to engage with their audience – and can leave search tactics behind. A difficult topic to handle in the B2C industry but for B2B very helpful.

“There are still many brands who haven’t figured out why they’re in social media. We still talk to brands that are trying to determine if they should be in social media. The data suggests the two most important subsets in social are user reviews and category blogs, rather than sites like Facebook, Twitter and YouTube.” Chris Copeland, CEO, GroupM Search

Some important findings on how social and search are linked together…
– 86% see search engines important in buying decisions – Consumers use search in buying cycle as a pricing tool (research products and select purchase location)
– 45% use search throughout the buying cycle
– 26% use search at the beginning of their research and shopping process
– Social is essential in the consideration process
– 30% use social media to create a shopping short-list
– 28% say social media has a valuable impact in creating awareness for brands and products

Spot On!
The study shows the impact that the combination of social and search have on the purchase decision. The challenge for companies will be to understand in which way to balance their tactics between search and social in reference to seasonal sales timing, marketing opportunities while not destroying maximum margin, and customer loyalty programs to amplify brand buzz. Another study by econsultancy also illustrates how undervalued social media and search are from a sales perspective. The study says that Social Media “gets eight times less credit for its direct contribution to sales than it should” and “Generic SEO gets credited for 14 times less sales than it deserves”.

What comes first when you take buying decisions? Search or Social? And how does it amplify your buying process? Interested in your thoughts…

Volkswagen inspires kids – "May the force be with you!"

Usually, I tend not to write about my family life, and the habits of my kids. Volkswagen manages now to break my personal rules of content creation, sharing and blogging. Let me share something that’s hunting me at home for some months now. And I don’t know if Volkswagen does me a favor here…

We have it all! Light sabers in all colours: green, red, blue, purple, and even with changing colours when you press the button. Uncountable Lego products, books, pens, balls, brithday invitation cards – you name it. Thanks to a trip to the Wonderland for Star Wars fans America, there is nothing missing in our house related to Star Wars merchandising.

And how often was my son chasing me inhouse, wearing his black Darth Vader cap and his Darth Vader helmet. And even our little one already copies his big brother. There is only one thing missing… They don’t have “the force” yet. Which makes me feel quite relaxed these days as you can imagine. But maybe there habits will change today…

What is that one thing which human being -as well as my little ones- are still striving for? The force!

After adidas last year at the World Cup, Volkswagen now pics up a Star Wars topic in their new Super Bowl commercial. And the social web might do its magic to make this one of the most popular virals at the moment to be spread via YouTube and the likes.

The commercial is starring a little boy who tries to move objects with the power of his personal force. And he only succeeds once…

YouTube

By loading the video, you agree to YouTube's privacy policy.
Learn more

Load video

Yes, it seems that kids will find the magic in this car. Maybe if Volkswagen sells light sabers or gowns or Darth Vader helmets with it. I don’t know. My son loves the ad. If he will buy one of the new Passat 2012?

“May the force be with you, Volkswagen!”

PS: You might also check-out some other great Super Bowl commercials here.