Tag Archive for: Website

The (Mighty) Future of Selfies

When you think a “selfie” is nothing but a “selfie” (meaning a photo of yourself), then you are still living in the past. The future of the selfie is already here – in various forms. You just need to know where to find the next evolution step, how to make it, and see who can assist your efforts. And even if you want to take it to extremes. There are all sorts of selfies ahead.

Although, I have to admit I have taken some selfies lately, I had decided to leave it from now as of bad (or mad) output. However, maybe I just need to go to the DELL Center for Selfie Improvement. No joke! Well. Maybe.

Dell is always good at jumping on the latest trends in the world of social and sharing. Their new “Center for Selfie Improvement” is meant to help people optimize (if not perfect) the art of the selfie. People shall be trained using different techniques handed down from the very original selfie taker. How this works is explained in this video and on their Tumblr website.

YouTube

By loading the video, you agree to YouTube's privacy policy.
Learn more

Load video

Some people might say “selfies” are just for people with mega egos. Now, if you are a person of that sort, this winning Cannes Lions Innovation Grand Prix might make you happy. It’s a mega Kinetic installation which enabled people to create massive 3D selfies. The installation can transform in three dimensions. It recreate a selfie face from visitors to Khan’s pavilion. The Khan’s building was a 2,000 m2 cube placed in the Olympic Park in Sochi during the 2014 Olympic Games.

Vimeo

By loading the video, you agree to Vimeo's privacy policy.
Learn more

Load video

MegaFaces: Kinetic Facade Shows Giant 3D ‘Selfies’ from iart on Vimeo.

And if you are living in Sweden or Australia, you might not even want to use the release button from your camera or your smartphone any more for your selfie. Just get the latest app from the guys at Crunchfish then. With their GoCam app (just Apple yet) you can take a selfie with their touchless-A3D-software. Simply raise your hand to “push” the release button.

The future of the “selfie” is weird, unimportant and funny. Well, it just reflects the nature of a selfie, right?

Websites that teens love (Infographic)

Are teens real trendsetters when it comes to using the latest online gig or social networks? Well, Niche gives some insights into the websites that 7.000 high school graduates in the U.S. were using lately.

Although many of us would have thought that Facebook is not the biggest hype for them any longer, the interactive infographic provided by Niche proves that 87% of the graduates are still happy with reading their news and being active on Facebook. Instagram makes up 66% and Twitter is used by 55%.

In terms of quick chat platforms, 72% use Facebook Messenger and 65% are active on Snapchat. Those platforms that are said to be the latest trend like YikYak and Whisper are not really getting big activity rates – 97% and 95% don’t use these platforms.

From a broadcasting point of view, it is interesting to see that YouTube, Netflix, and Pandora are the leading edge platforms whereas Hulu, Spotify and Beats like Amazon Prime are not yet their main interest spot.

PS: The interactive infographic with further info can be seen at Business Insider.

Websites Teens Niche 2014

Study: Social and Native Ads beat Email in Branding

A recent study suggests that marketers should focus more on social media advertising and native promotions. The results of the study conducted by Millward Brown Digital for MediaBrix show that these tactics are more effective than email.

The respondents -300 marketers from Fortune 5,000 companies in 17 business categories- of the study answered with the follwowing response on which advertising formats and types “meet their digital branding objectives” on a multiple choice and multiple selection questionnaire.
– Social (51%)
– Native (46%)
– Email (36%)
– Paid search (23%)
– Mobile Web (23%)
– “Emotionally targeted” in-game (20%
– Mobile in-app (20%)
– Programmatic (18%)
– Regular in-game (14%)
– Text messaging (12%)
– Direct purchse ads from websites and blogs (11%)

When Millward Brown asked marketers on their preferences on “what types of digital ad campaigns has your company conducted”, the reponses were quite similar. Of the responding marketers, 77% mentioned that social is their way forward where as 73% replied email and 68% were heading for native. Although this might suggest that email marketing is a thing of the past, the marketers did not say that email does not work any longer.

Seeing news from Procter & Gamble marketing lately, it illustrates the confusion generated by the marketing industry on what’s the future of advertising going to be like. P&G will invest 70% of their advertising in programmatic in the future. A move that follows the American Express example trying to shift 100% of digital ad buys to programmatic. Against this movement stands some results of the Millward Brown study which shows that 30% of digital marketers understand that programmatic advertising creates some negative consumer experiences, with the unfavorable result in not leveraging but hurting brand loyalty or negating their branding objectives.

Please finds the main results of the study in the following infographic.

Infographic-Social-Native vs Email

Infographic-Social-Native vs Email

Report: Most Trusted Marketing Automation Tools

Marketing automation tools are making their ways into the business world, not only for large enterprises but also for small companies some solutions have proven to be promising, and not only since IBM bought Silverpop. However, which tools are the right ones for your business? At least we get some advice now from TrustRadius“Buyer’s Guide to Marketing Automation Software”. They did a report based on 400 in-depth reviews by authenticated end-users of marketing automation products combined with the results of more than 10,000 comparisons performed on the TrustRadius’ website.

The report looked at software solutions that include various demand generation capabilities like email campaign management, landing pages,or even lead scoring. However, the analysis out those providers which just offer one aspect of marketing automation (i.e. only lead scoring). In their focus were those tools that “help to automate and scale repetitive marketing tasks and the analysis of those efforts.”

These were the findings they came up with…

Small Businesses (Up to 50 employees)
Small companies gave quite positive and high ratings with at least a 4 out of 5 (average was 4.3 out of 5 – better than the average in the midsize and enterprise companies). Then TrustRadius ranked the products via two factors: a) average user rating and b) how does the product serve the business segment (determined by the number of comparisons made by organizations of that size).
The leading 3 solutions were HubSpot (4.8, 69% of comparisons by small businesses), Act-On (4.7, 53%), plus Infusionsoft (4.3, 96%). Other solutions like Marketo, Pardot, Eloqua, and Silverpop also got good ratings. Still, they ranked lower as they had a smaller proportion of small business comparisons.

TrustRadius Marketing Automation Small Business 2014

SMB Businesses (From 51 to 500 employees)
The average rating in the midsize company category was 3.9 out of 5. The report shows that a higher demand goes alongside bigger companies and more complex requirements for marketing automation tools. Here, the trusted vendors are Marketo (4.2, 60% midsize category) and Pardot (4.0, 58%). Act-On, Eloqua, and HubSpot also got positive ratings.

TrustRadius Marketing Automation SMB 2014

Enterprise Businesses (500+ employees)
The average rating for enterprise marketing automation products was 3.8 out of 5. Eloqua showed up to be the top marketing automation software for enterprise companies (4.4, 59% enterprise focus). Act-On, HubSpot, Marketo, and Pardot also performed well according to users, but they had a smaller proportion of comparisons from enterprise customers.

TrustRadius Marketing Automation Enterprises 2014

Tell us about your findings. Which tools do you use and what has proven to be successful for you? All insights can help other companies make faster decisions.

Infographic: How Google Ranks Your Website's Relevance

Google Rank WebsitesThis is one of those secrets that is discussed in every single seminar we do: How does Google rank websites? Why does my website not rank higher than my competitors? What could be the best SEO strategy so that Google ranks us under the first three results?

The Google’s algorithm is one of the biggest secrets in the marketing world. The 200+ ranking features make it very challenging to find the right web strategy of your content and website structure. So, what’s the best way to develop a “Google-loves-us” strategy?

Neil Patel has created a nice infographic that illustrates the main components of the Google algorithm. Let’s see what he comes up with…

How Google Determines Where to Rank Your Website
Courtesy of: Quick Sprout

Spot On!
The main challenge to drive more traffic via search lies in understanding the holistic approach of Google’s algorithm. Obviously, it is about the final user that works with the website, reads the content and shares it through their own social communication platforms. Over are those days when people though the “link-in-link-out” game will solve the SEO war, when companies got paid for building link farms, and people got money to bring more links in. In the end, the user decides on what they need, and finally the Google Algorithm reflects that.

Study shows, how B2B decision-makers consume vendor content

Some weeks ago, we spoke about a study that described what B2B decision makers expect to read on vendor websites. Now, a new study of 352 buyers (predominantly large businesses) from The CMO Council and NetLine shows that the majority of organizations (94%) favors to curate and circulate relevant content in their organization before finally deciding to purchase B2B solutions and services. For years, marketers thought B2B buyers and influencers alike are simply using vendor-related content from time to time.

The study makes clear that there is no real sharing structure to be made out from company to company. However, there are three main patterns that the study highlights in their results:
From the Middle Out (35%): Execution-level executives search and find content about vendors/products and make the purchase. Senior management gets educated thorugh them why the decision was made.
From the Bottom Up (30%): Junior or mid-level employees find vendor-related content and share their discoveries with senior management. Then they make the final decision.
From the Top Down (29%): Senior managers find the content, then share it with lower-level managers for analysis and final purchase.

CMO Council Netline B2B content sharing

The same as with the sharing patterns, there are three key personas within the businesses who act according to their own behaviors, expectations and needs.
Researchers: Primarily focused on new industry reports/research to inform them of advancements in solutions, trends affecting the markets, and opportunities for improvement.
Influencers: Interested in both thought leadership found in trusted third-party channels and vendor-branded technology specifications, data sheets, and use cases. Their special interest is in summarized content, i.e. infographics, videos, and blog comments.
Decision-Makers: Want to stay informed through broad research reports and analyst commentary. However, they expect to have access to detailed data to enable better decision-making at the tail end of the purchasing funnel.

Spot On!
The study reveals some further interesting insights. The vendor selection is major to moderate influenced by online content, find 88% of the B2B buyers and more than a third (38%) find that online content provides strategic insights and shapes the purchase decision. The content that is valued the most is research reports and studies (65%), technical spec and data sheets (50%), analyst reports (46%), whitepapers (35%) and posts on trade publishing sites (30%). The power of Google and the vendor website comes out as well: When more than two third state they start their vendor-related content sourcing with search engines and portals, it shows that the best training the marketers is to read the two B2B studies and draw some conclusion out of it for the future of your own content, PR and marketing acitivites. And if you cannot find a solution, we are happy to help…

Study: What B2B buyers expect to see on vendor websites

Is it really still the phone number and the email address? Well, at least contact information should be easily accessible on B2B vendor websites. This is the main finding of a recent report from Dianna Huff and KoMarketing Associates.

The study, based on a survey of 175 B2B buyers, states that the majority of B2B buyers (68%) find the vendor’s address and contact information is mission critical information. Thus, 55% make clear they’ll leave the website if it isn’t accessible. For most B2B buyers (81%) want to contact vendors via email in the first place, phone comes in second place (58%). Furthermore, it is not only about accessibility. Credibility of a vendor’s website establishes for 51% of the respondents when contact or about information is displayed.

Huff:koMarketing 2014 - Content Assets Credibility

From a content perspective, 43% of buyers see pricing as a “must have” content on vendor websites. Having worked with different b2b vendors in the last years, we know that the challenge for them is the indirect sales when partners have different levels of pricing models that often cannot be displayed public; however separate logins can handle that challenge.

90% of buyers expect to see product/services information on vendor websites. They also want to see about/company information (61%), marketing collateral (37%), and testimonials (36%). Although social media becomes more impact in our daily business, only 24% try to find social media add-ons (24%) or look for blogs (22%).

Huff:koMarketing 2014 - Website Info People want to see

Spot On!
Although the contact form is the most common way to get in touch with the vendor, only 39% like to use it. This is critical as buyers usually do not take too much time to stay on vendor websites.

Especially when getting bored or when they click out of a website, buyers tend to leave. Another mismatch that makes people leave is when video or audio plays automatically (93%). Animated ads, like crawling banners or pop-ups are also a NoGo for 88%, and a bad positioning about company offers makes 83% move to the competitor sites.

Social Media Complainers… and how to deal with them (Infographic)

Probably you have been one of those social media complainers in your career of tweets and status updates yourself already. If not, maybe you have heard of some of these types from your customer service unit or your sales team. Be aware: Complainers are everywhere, not only on your website or social hubs!

Some studies show that most big companies still do not take social media complains from the social web serious. Comments on brand’s blogs, Facebook or Twitter profiles stay uncommented, or are just a given option to calm the user down and then make them forget about their issue if it is not too complex. Most customers take this personal and just turn to competitors. The revenue of these customers gets lost.

But how can you differentiate between the types of complainers? How can you know who to take serious, and who not? Which typer of complainers should you respond, and how? The guys at ExactTarget have created a nice infographic that helps you structure complainers from

Social Customer Service Complainers Infographic

Content: Secrets of a killer blogpost (Infographic)

Many marketing, PR or product managers think about starting their own blogs when joining one of our inhouse or open seminars. And for most of them, it has become a challenge just finding the right topic that makes them outstanding with their product or service offering. This is not surprising, bearing in mind that there were already 74.874.233 WordPress websites out there when I wrote this post – and when you think about Blogger, Typepad, Tumblrs and all of those enterprise blogs, it becomes a mission impossible to find a niche that helps building brands.

Now, the guys at WhoIsHostingThis.com have published some helpful infographic which give us some quite good arguments on what matters when you start blogging.

Which Content?
There is no magazine without a smashing title. Ideally, you write about the topics you are an expert in. As people will want credible, meaningful and authentic blog posts, this is the only way to get your readers attention. Then, check out what readers do want, discuss and share on your topic via social media monitoring. This will make your content interesting and will prevent you from writing content that nobody reads.

Original or Curated?

If you have got the time to write original content, go for it. It’s the best for your reputation and shows your own mindset. And most importantly, Google likes original content which is more likely to rank better. Whenever, there are guest bloggers who want to contribute to your website, invite them.
However, the truth is that if you curate your competitor’s content or third party content from time to time (with a back link!), you jump into their fish-bowl. The easiest bit is if you use their infographics, webinars and branded industry blogs to expand their ideas and thoughts.

Consistency? 

Find your style and stick with it. People want to feel “at home” and comfortable. Figure out when most people share your updates, or when it’s better not to send them live. If you can afford it, stick to an editorial calendar as people love publishing source they can rely on finding the relevant set of information that stands out.

Good luck (and if you need help), we are here to advice…

How-to-Write-a-Successful-Blog-Post

B2B Study: Buyers behavior insights on conversion and engagement

Are you planning your lead generation programs at the moment? Well, you better be quick then. Why? The conversion rates for B2B online lead campaigns generate the best results when the year starts – so now! The reasons are quite obvious: Budget are fresh or renewed. Funds are starting. Conversion falls below average in the Christmas month, probably as of intense planning activity and budget cuts. Not surprisingly, the summer months show a significant decrease in conversion activity.

The findings are coming from some recent analysis by Software Advice, based on data generated from over six million visitors to the Software Advice website in the last 5 years. Although this might be some very detailed experience for the B2B software industry, it is still valid and applicable for the whole b2b industry if they do lead generation programs.

Study Software Advice Conversion By Month

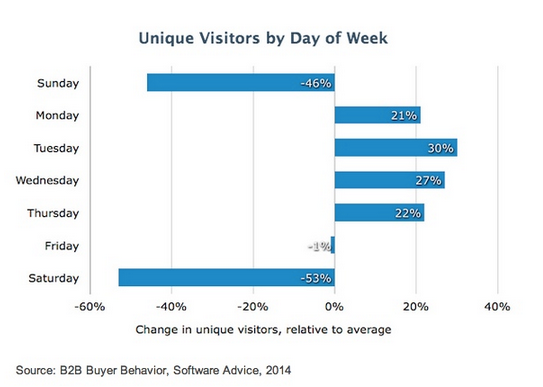
The report shows that B2B buyers were most active on the Software Advice website Tuesday through Thursday, with Tuesday being the most active day and Wednesday driving the highest conversion rates.

Study Software Advice Conversion By Day

Interestingly enough, traffic peaks in the first half of the day, and especially around lunch time. 53% more unique visitors showed up during work hours when compared with Software Advice’s unique visitor traffic.

Study Software Advice Conversion By Hour

Spot On!
Comparing this with other engagement studies from the social media world (here and here), we see that the time around midday seems to be best to get people engaged in content marketing, social media and lead generation. Speaking from our own experience with silicon.de over ten years, I can say that the morning hours when people get their first coffee were also successful in lead and demand generation.