Tag Archive for: User

Report: Friday is Engagement Day on Facebook

The more work people have the less they have got time to engage on Facebook. Right or wrong? Well, right…

At least according to a recent report from Adobe that states Facebook users engage with brands more on Fridays than any other day on in the week. In their Q1 Social Intelligence Report which analyzes the interaction of Facebook posts and ad engagements, the company found that 15.7% of all impressions happened on a Friday.

Adobe FB Engagement Q1 2014

In the second place came Thursdays with the second highest post impressions and engagement (14.5%), followed by Saturday (14,4%) with almost the same share of impressions. Sunday appears to be the day when people are not massively engaging with Facebook compared to the rest of the week (13.4%). A detailed interaction overview shows that Fridays were the strongest interaction days examined across all engagements: comments (17%), likes (16%) and shares (6%).

Adobe FB Share of  Engagement Q1 2014

Furthermore, the report which was based on 260 billion Facebook ad impressions across different industry sector like media, entertainment, retail and travel, makes clear that photos and video seem to become the new secret sauce in user engagement on Facebook. Photos still show highest engagement rates in the first three months in 2014. 24.7% of all brand video views in Q1 came in on a Friday. Although people have more time on Sundays, it is the day with the lowest share of video impressions (6.4%). The engagement around video updates were up 25% year on year and 58% quarter over quarter.

Adobe FB Video Engagement Q1 2014

What are your findings around Facebook updates? What content types perform and which don’t? Is Friday really such a powerful day for you as well?

Report: Most Trusted Marketing Automation Tools

Marketing automation tools are making their ways into the business world, not only for large enterprises but also for small companies some solutions have proven to be promising, and not only since IBM bought Silverpop. However, which tools are the right ones for your business? At least we get some advice now from TrustRadius“Buyer’s Guide to Marketing Automation Software”. They did a report based on 400 in-depth reviews by authenticated end-users of marketing automation products combined with the results of more than 10,000 comparisons performed on the TrustRadius’ website.

The report looked at software solutions that include various demand generation capabilities like email campaign management, landing pages,or even lead scoring. However, the analysis out those providers which just offer one aspect of marketing automation (i.e. only lead scoring). In their focus were those tools that “help to automate and scale repetitive marketing tasks and the analysis of those efforts.”

These were the findings they came up with…

Small Businesses (Up to 50 employees)
Small companies gave quite positive and high ratings with at least a 4 out of 5 (average was 4.3 out of 5 – better than the average in the midsize and enterprise companies). Then TrustRadius ranked the products via two factors: a) average user rating and b) how does the product serve the business segment (determined by the number of comparisons made by organizations of that size).
The leading 3 solutions were HubSpot (4.8, 69% of comparisons by small businesses), Act-On (4.7, 53%), plus Infusionsoft (4.3, 96%). Other solutions like Marketo, Pardot, Eloqua, and Silverpop also got good ratings. Still, they ranked lower as they had a smaller proportion of small business comparisons.

TrustRadius Marketing Automation Small Business 2014

SMB Businesses (From 51 to 500 employees)
The average rating in the midsize company category was 3.9 out of 5. The report shows that a higher demand goes alongside bigger companies and more complex requirements for marketing automation tools. Here, the trusted vendors are Marketo (4.2, 60% midsize category) and Pardot (4.0, 58%). Act-On, Eloqua, and HubSpot also got positive ratings.

TrustRadius Marketing Automation SMB 2014

Enterprise Businesses (500+ employees)
The average rating for enterprise marketing automation products was 3.8 out of 5. Eloqua showed up to be the top marketing automation software for enterprise companies (4.4, 59% enterprise focus). Act-On, HubSpot, Marketo, and Pardot also performed well according to users, but they had a smaller proportion of comparisons from enterprise customers.

TrustRadius Marketing Automation Enterprises 2014

Tell us about your findings. Which tools do you use and what has proven to be successful for you? All insights can help other companies make faster decisions.

Infographic: How Google Ranks Your Website's Relevance

Google Rank WebsitesThis is one of those secrets that is discussed in every single seminar we do: How does Google rank websites? Why does my website not rank higher than my competitors? What could be the best SEO strategy so that Google ranks us under the first three results?

The Google’s algorithm is one of the biggest secrets in the marketing world. The 200+ ranking features make it very challenging to find the right web strategy of your content and website structure. So, what’s the best way to develop a “Google-loves-us” strategy?

Neil Patel has created a nice infographic that illustrates the main components of the Google algorithm. Let’s see what he comes up with…

How Google Determines Where to Rank Your Website
Courtesy of: Quick Sprout

Spot On!
The main challenge to drive more traffic via search lies in understanding the holistic approach of Google’s algorithm. Obviously, it is about the final user that works with the website, reads the content and shares it through their own social communication platforms. Over are those days when people though the “link-in-link-out” game will solve the SEO war, when companies got paid for building link farms, and people got money to bring more links in. In the end, the user decides on what they need, and finally the Google Algorithm reflects that.

Social Media Complainers… and how to deal with them (Infographic)

Probably you have been one of those social media complainers in your career of tweets and status updates yourself already. If not, maybe you have heard of some of these types from your customer service unit or your sales team. Be aware: Complainers are everywhere, not only on your website or social hubs!

Some studies show that most big companies still do not take social media complains from the social web serious. Comments on brand’s blogs, Facebook or Twitter profiles stay uncommented, or are just a given option to calm the user down and then make them forget about their issue if it is not too complex. Most customers take this personal and just turn to competitors. The revenue of these customers gets lost.

But how can you differentiate between the types of complainers? How can you know who to take serious, and who not? Which typer of complainers should you respond, and how? The guys at ExactTarget have created a nice infographic that helps you structure complainers from

Social Customer Service Complainers Infographic

How fast the leading social networks are growing…

It is one of these questions, we always get asked in meetings and seminars. How much is social media growing, or is growth already declining? Search Engine Journal provides some good overview on the topic of growth and use in an infographic just recently released.

The most popular sites -in terms of how they are used by marketers- are still Facebook, Twitter, and Google+. Same as in the study from Global Web Index in 2013, Twitter still shows the fastest growth in social networks from an active user perspective, especially in the 55-64 age group.

In the time period from June 2012 to March 2013, Google+ increased their active user base by 33%. The age group of 45-54 years showed the fastest adaption growth in Google+ with a 56% increase.

And Facebook? Although they showed a 23% increase, especially the age group of 45-54 years is adapting the fast moving “Likes and Hypes” network.

SEJ-Social-Media-Growth

Study: Why corporate newsrooms fail to meet journalists' needs

Credits: © momius - Fotolia.com

Credits: © momius – Fotolia.com

The value of corporate newsrooms has been discussed for years. Now, a recent Proactive Report survey by Sally Falkow, president of PRESSfeed: The Social Newsroom, gives insights into what the power of newsrooms could be and where journalists stand so far with them. The survey strikes the fact that the PR industry hasn’t adapt to the latest image- and video-based environment that users and journalists alike are looking for; especially videos and embedded codes which only one third of the newsrooms surveyed offered. The report makes clear that the majority of journalists (83%) sees images with content important, still just 38% of them add images to news content.

From Falkow’s perspective, many corporate newsrooms do not provide the content and links that journalists “are looking for, and things they think are important, and things that make their jobs easier for them, and that they would therefore use that content more readily.” The value of pictures for content could be seen when Twitter started displaying pictures in peoples’ feeds, so that users did not have to click the link connected with it, she states.

The main findings from the survey…
– Just 37% of online newsrooms provide videos and embedded codes compared to 82% of journalists asking for it
– 49% of online newsrooms fail to meet the standards of images for publications, only 39% of corporate newsrooms offer an image gallery
– 53% of journalists find video important with content, but only 13% of PR professionals are adding videos to their news, and only one third have a video gallery in their newsroom

So, the question is why companies fail with their newsrooms? Sally Falkow’s answer is as simple as it is obvious: “The No. 1 reason that they quote is lack of resources and, also very close behind, lack of skills. They don’t know how to do it.” Based on the knowledge of their 2013 newsroom study, Peter Ingman, founder of the newsroom technology platform Mynewsdesk, responded: “The power of images and videos have become central parts when coaching companies on how to set up newsrooms with our technology. Providing news and information to journalists has to be three things: simple, simple, simple! It has to be an easy process of uploading data for companies and easy to implement the appropriate content articles and posts for the media contacts. Journalists need to have or find the essential data for their reports and articles without challenging search activities. Come, find, implement – this is the key to successful newsrooms!”

Spot On!
The way journalists work has not changed drastically over the last decade in the way investigating for the news content works. Check the media, check Google, check the brands. Newsrooms offer new opportunities to journalists, social influencers and brand advocates to access data faster with an “everything-at-a-glance” perspective. The use of implemented analysis tools, clever SocialCRM technology, and by changing the way employees are allowed to speak for their brands via online channels, newsrooms foster brand and trust building. However, newsrooms can sometimes be of good and bad experience as the standard in companies newsrooms varies, apart from the different technologies that companies use, from self-developed platforms to personalized SaaS newsrooms.

Often enterprises have got newsrooms up and running already like Daimler, AUDI, ING or Costa Coffee. Still, most SMBs don’t even think about it as they are still relying on their traditional way of spreading news via content distribution platforms – an outdated way in terms of the value it provides for SEO, and even more (or less?) for journalists. Companies should start thinking about providing value with their newsroom in the form of video quotes or brief updates or blog posts alongside photos about the latest developments or news in the company or the market. Quick and simple information bites that come via tweets, Facebook updates or direct mail out of platforms straight to the editor, optimized according to their user behavior. It will make a massive impact on brand reputation and the way journalists will work with corporate newsrooms in the future.

Best and worst times to post social media updates (Infographic)

The questions we get asked by management team all over Europe are quite similar whenever it comes to best possible conversion times, or perfect hours and days to posting on social networks, to send out updates and to generate engagement. Although this might be an option to boost your social and web activities, it should be clear to everyone that if we all obey these options, we are challenging our clients more and more in generating engagement.

Above all, not all social media platforms are alike. The user types of social networks are different, depending on whether these are coming with a purchase intent, the idea to keep their friends up to date about their latest spare time activities, or whether they are looking for new job opportunities in career networks. Sentiment, time and openness for your updates might vary from minute to minute.

Mitt Ray summarizes some advice on when could be the best and worst time to publish your updates on Facebook, Google+, Twitter, Linkedin, Pinterest and Tumblr. Take it for whatever it is worth to you…

Best-Times-and-Days-to-Post-Your-Social-Media-Updates-Infographic

Study: Business Elite increasingly embraces mobile technology

Harald Wanetschka  / pixelio.de

Harald Wanetschka / pixelio.de

Does mobile technology really have “more influence on global change than countries, governments or corporations”? Well, at least if we can believe in the 50% of respondents of a new European research by CNBC called “Europe’s Mobile Elite 2013”. The study states that Europe’s business elite continue to embrace the latest smartphones, tablets and devices. In general, most European business executives (73%) believe that they are keeping up with technology change within their sector, however almost less than four in ten are not confident with their companies’ technology change.

The study shows that most business leaders own a mobile device (90%), live and like the mobile business and are agreeing that life is “easier” (68%). Even more, 64% see their lives becoming more productive and enjoyable. Apple is still leading with 44% owning an iPhone versus Android users with 35%. Obviously tablets are on the rise as well with almost. The merging worlds of private and business becomes clear with the fact that 72% (up 39% from 2011) use their tablets for both work and leisure.

Not surprisingly, two thirds value tablets “useful business tools”. Also second screen usage is big among the business elite: 75% watch TV at the same time as using their tablet. The engagement effect of the tablet is striking with nine in 10 of these consumers taking some form of action on their tablet as a result of seeing TV content. And when the study shows that a third of the business executives are responding to TV advertising, marketers should think about ow to implement clever brand and lead generation campaigns in their TV spots. And when marketers want to reach the business elite, they are best in sending out their messages in the evening and at weekends (tablet usage). Smartphones are always-on, so no special advice here.
 
“This study shows the huge influence mobile technology has on our lives. Europe’s elite are keeping up with technological change, owning more devices than ever and using each in different ways. In the area of social media and its value in business, the jury is still out and it will be interesting to see where this leads next year.” Mike Jeanes, Director of Research, EMEA, CNBC.

Top content for tablets…  
– business and financial information (72%)
– web browsing (70%)
– news updates (70%)
– email (69%)
– reading newspapers/magazines (69%).

Top content for mobiles…  
– email (79%)
– business and finance (72%)
– web browsing (70%)
– news updates (70%)
– GPS (69%)
 
Spot On!
Despite some common disagreement that the business elite is not on social networks, the study makes clear that 85% are a member of at least one network with 61% on Facebook, 58% on LinkedIn, and 43% on Twitter. It is important to note that 40% (up from 19% in 2011) of Facebook, LinkedIn and Twitter users are now connected to all three social networks. Furthermore, 58% of the business decision makers use social media for business (still private use is the standard for 75%). It could be that private and business worlds are really not kept as separate any longer. The commercial impact of social media is seen critical. When 46% see social media “neither useful nor essential” (compare study 2012), it shows that most business decision makers had either the wrong advice or the wrong expectation raised by consultants. One of the reasons why we are always very critical in analyzing the benefit of social media for a company or brand, and trying to show the realistic benefit for companies.

The evolution of the mobile etiquette (Infographic)

Human interaction gets disrupted by new technologies like smartphones and tablets. Yet, we are still trying to figure out and learning how to engage with our mobile devices when other people are around. Time to rethink (mobile) etiquette. When is it ok to check our mails on our phones? At dinner with friends or during a conversation in a restaurant? There is no golden rule these days, and many people might define their own etiquette.

A recent infographic gives some mobile advice with some new etiquette ideas. The infographic by Deals.ebay.com is based on some studies which show some insights in mobile users opinions. The younger generation age 18-24 have obviously a quite relaxed understanding on how and when to use mobiles: 50% of GenY think texting is allowed during meals – compared to just 15% of people aged 30 and older.

PS: One term was even new to me: Phubbing -a short version of phone-snubbing. But, check it out yourself – and if you got some advice, start the conversation.

Via deals.ebay.com

Via deals.ebay.com

Ratings, Retweets, Repins & Likes: Automated response creators = killers of insight creation?

twitterview-2Some years ago, I have written about the Retweet button being the “killer of positive blog comments”. Over the years in many seminars and speeches, I have stressed the point that the ROI of the social web is not about generating high quantity in “thumbs up” on Facebook or Retweets on Twitter, or anything automated that comes along with similar meaning.
Retweets, Repins & Co. are only of value for your business, if…
– you accept those automated response generators as the pillars of your ROI system.
– you are a marketer who builds their business on proving the capability of accelerating reach rather than relevance.
– you are a brand that struggles to understood the value of building a community-centric business.
Still: Are ratings as insightful as a written comment – be it on Twitter, Facebook, LinkedIn or any other community platform out there in the social web?

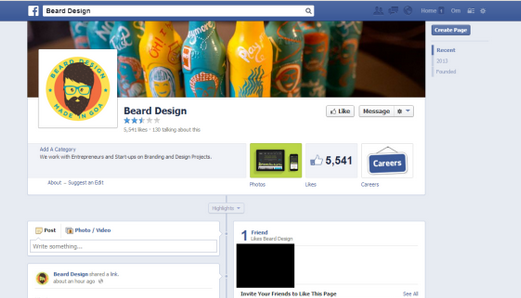
Yesterday, it became public through a post on TechCrunch that Facebook is testing out a system of openly displaying star-ratings on Pages. Will this be another killer of value creation?

I definitely agree that the Facebook “Like” has become confusing, and in some way worthless. Many users just click on the Like button out of a pure and immediate emotion, nothing sustainable, lasting or resilient. Some are expressing their solidarity with it. Some are missing the dislike button, and click the Like button.

Do those automated responses tell us what they really feel? Do they tell us what people really think? Do they help us to evaluate our position? Fair enough, these automated response creators are some word-of-mouth catalysts. Well, I admit by adding these five star ratings, there is at least some specification in the differentiation of generating feedback.

Obviously, the new rating system puts Facebook in a different position and moves it more to the likes of Foursquare, Yelp and traditional trend shop systems. Furthermore, it allows users to be more concrete in defining their opinions. Users might get better orientation in why a coffee shop or a business or restaurant deserves to be tested.

Spotted by TechCrunch

Spotted by TechCrunch

But does it really help us? What is a 4.2 with twelve votes compared to a 4.9 what two people have build up? Do we know who gave the votings, and if these people have the same interest and preferences that we have got? Doesn’t orientation get even more confusing? What will we book on travel websites when there are less and less reviews and recommendations?

Spot On!
The 3 Rs of the social customer (ratings, reviews and recommendations) might make our lives interesting and exciting for new stuff. But maybe there is too much new trends and products out there to get our heads around. Maybe a real review or recommendation will sometimes help (one positive and one negative like Amazon does it already). Still, automated feedbacks -be it stars, RTs, Likes, etc.- are the least valuable insight creation generators on a relevance scale that helps defining internal and external social web ROI.

PS: If your managers are still happy when your numbers of Likes go up, be happy and tell them nothing about this post. If not, let’s discuss further how social networks should constitute in order to deliver deeper insights in the mindset of our customers.