Tag Archive for: Infographic

Will those who pin finally win? – Pinterest & Engagement (Infographic)

What is interesting for marketers is how engaging Pinterest could be as the emerging new social network for pics and tricks. So which gender is using the platform the most? How much time are people spending there, and how much time compared to other social networks?

Here are some answers (US perspective) according to Wall Street Journal
– Facebook stays as the most engaging platform with 405 minutes per month
– Pinterest and Tumblr come in second place with 89 minutes
– Twitter is number three with  21 minutes
– LinkedIn gets 17 minutes
– Google Plus only has 3 minutes

Please find the infographic “Pin it to Win it” from MDG Advertising as follows with some more interesting facts about some of the best performing social networks…

The value of being "Linkedin"

Although some people still mess about the value of social networking, some platforms have already proven their success and benefit for companies and brands. From a B2B point of view, LinkedIn and Twitter are probably the two platforms that make most sense to marketers.

If Facebook has some value for brands that might be seen more from a B2C perspective. LinkedIn and Twitter have immediate B2B business impact. And business people predominantly use it for people searches it seems to understand their 3 Ps of their business: profession, position and potential.

LinkedIn is the star in this space in terms of business input, lead generation and some deep information exchange with their groups. This infographic from OnlineMBA states some valuable and interesting data about LinkedIn…

– 150m+ professionals globally (LinkedIn company profile stats – February 9, 2012)
– 44m+ members in EMEA region (LinkedIn company profile stats – February 17, 2012)
– registered business professionals from over 200 countries
– executives from every Fortune 500 companies
– 74% have a college degree, 26% even a graduate degree
– 1% of users are responsible for 34% of the traffic
– 1 million new users every 12 days = equals 1 new user per second
– 69% of users with at least $60K annual income
– 39% of users with more than $100K annual income
– 2 Billion people searches in 2010

Pinterest: First facts & findings (infographic)

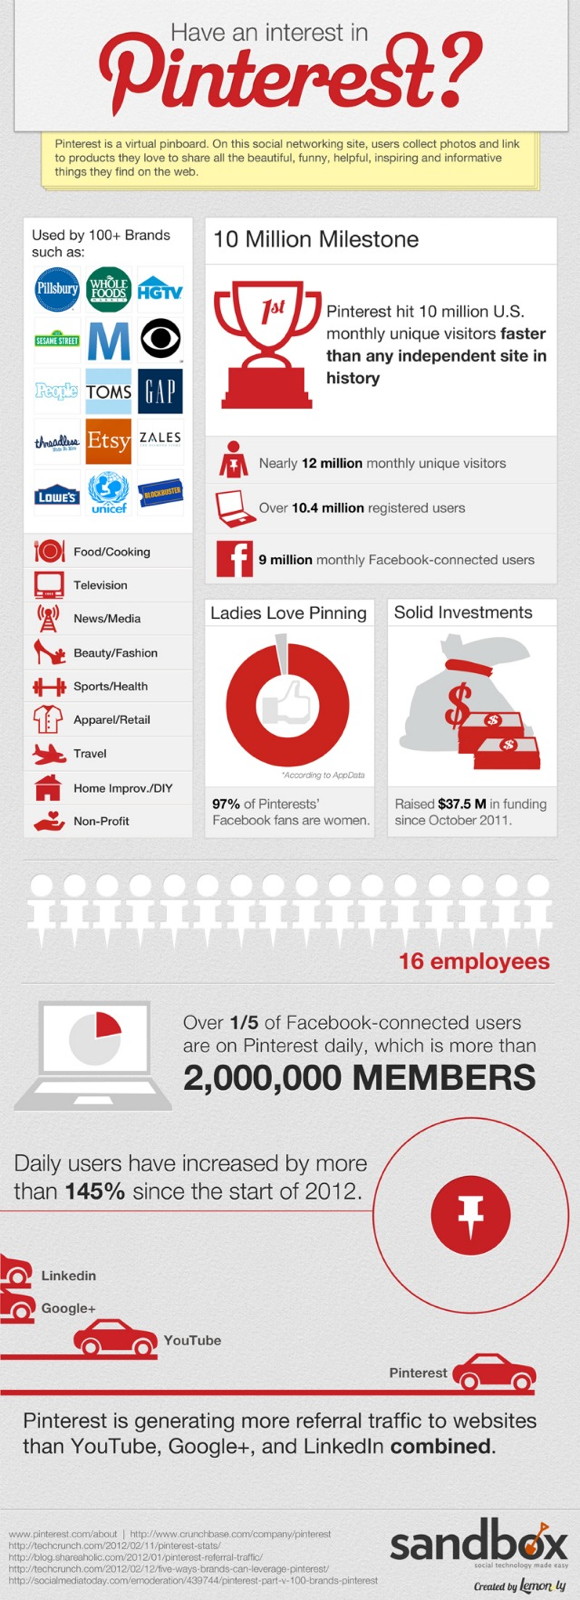
Pinterest is making the world crazy these days in 2012. Are you on it? Sure, most of the Social Media guys out there are exploring ways to make money with it. The funny thing is: You don’t need more than 16 employees to rock the Social Media sphere. That’s the actual size of the company.

A company called Lemon.ly collected some interesting data from the platform Pinterest. They found out that 10 million users are on Pinterest already, 97% of Pinterest’s Facebook fans are women, and it is obvious how the platform might have an influence on designers and marketers.

Some more findings and facts…
– 12 million monthly unique users
– 10,4 million registered users
– 9 million monthly Facebook-connected users
– 145% daily user increase in 2012

What is your perception of the platform? What is the main difference to picture and photo sharing platforms like Flickr, Picasa or Instagram? And what is the benefit using the platform from a business perspective?

Memories – History of Disruptive B2B Innovations

Sorry, if I am getting emotional in this post… After far more than 1.000 posts, there must be one that is more personal than the rest of this blog: Memories.

I haven’t been alive 1851. Well, I am not alone on that one, right…?! No, I haven’t changed the world.
Obviously. Many of the companies on this infographic could not make this happen…

However, in 1999 something happened that I did not expect those days, or when I started my career in the B2B marketing and media world. It was disruptive in my B2B marketing life. Ok, I admit it was no innovation…, maybe some tiny idea and thoughts were those days. It was a milestone for me personally. And a tipping point in my business experience…

Getting an award is something that gives people a career kick. No Grammy. No Oscar. No… whatever. Having an award from the company that is mentioned at the beginning of this chart is something special to me, especially when you were young, inexperienced but eager to become better and better in business. When United Buisness Media bought CMP in 1999, I achieved a Salesperson of the Year award from CMP. Big emotions, big memories, I can tell you…

Seeing JESS3 and Eloqua mention CMP in their history of disruptive B2B Technolgy Innovations infographic brought back these long forgotten memories. I haven’t seen anyone mention CMP for years…

This infographic is not only rewarding the importance of content marketing, it also shows that content marketing will remain to be relevant and thrilling in the future. However, it might shift more and more from text to audio-visual touchpoints? We will see…

PS: Thanks to Mai Nguyen to ping this through to me…

Study shows: Customers are social, Brands not…!

The IT company IBM were the first to make brands aware of the perception gap between what customers want from brands on Social Media, and what companies see as necessary. Some new studies from the Chief Marketing Officer Council and Lithium make clear that this perception gap widens.

What customers want…
The CMO Council asked 1,300 customers from around the world in a multiple-choice study. They discovered that 67% followed or liked brands to receive discounts and special offers. 65% replied that they connected with brands in order to get access to games or competitions while 60% want to connect with other customers.

What brands see…
The astonishing fact is that when the same survey was held with 120 CMOs (chief marketing officer), the results showed similar figures with the IBM study: Only 33% of the CMOs believed that their Social Media fans and followers were engaging with the brand for some kind of incentive or reward. Even more, just 27% understood that their customers were after exclusivity in terms of experience and savings.

Spot On!
Social Media is not a top three priority for one in ten CMOs. The reason is not changing for years probably. 67% said a lack of time and resources makes up for their poor efforts. This is even more amazing when we consider that 72% of the customers use Social Media to connect with brands. AND: 80% are more likely to try a product based on a friend’s recommendation on Social Media, which probably means a Social Network. There is no explanation that could make sense for this Social Media ROI (=Risk of Ignorance).

PS: This little infographic illustrates the digital divide between customers and brands.

The CEO of the future is social

This new infographic from CEO.com illustrates that more and more CEOs are figuring out social media and finding great benefits as a result. Some weeks ago, we could see in a study that European business chiefs understand the power of Twitter and support its use these days. It seems Social Media is making its way to the C-levels.

Will the CEO of the future really be more social…? Let’s see…

Profiling the social customer (infographic)

If marketers are looking to understand the profile of a social consumers, they need to have deep insights into their souls and needs. Beyond Digital has asked 3,000 US and UK consumers about the two products and services they had most recently researched online and which steps take them through the purchase process.

Apart from showing gender differences, sharing becomes the main element of strategy. The social consumer is a two-faced personality: First, they can either be categorized as a high or low sharer. A human being that utilizes differtent digital channels in a different manner, depending on whether he or she is researching and interacting with high or low involvement products. Those with a high sharer profile are the most valuable for brands. They recommend products 3x more often and influence others’ purchases…

How students see the future workplace (infographic)

Foreseeing the future workplace might be a challenge. Especially, if you think of the digital native generation (millenials) some IT decision maker will get grey hair, in terms of policies and mobility aspects.

Most people in the UK (58%) say, the traditional office will be extinct by 2021. In their Technology Report Cisco was asking 2.800 college students how they see the future workplace and what they expect from it. 69% of students don’t see the necessity of an office in the future – an increase by 60% compared to last year.

Is this how Google affects our memory? (infographic)

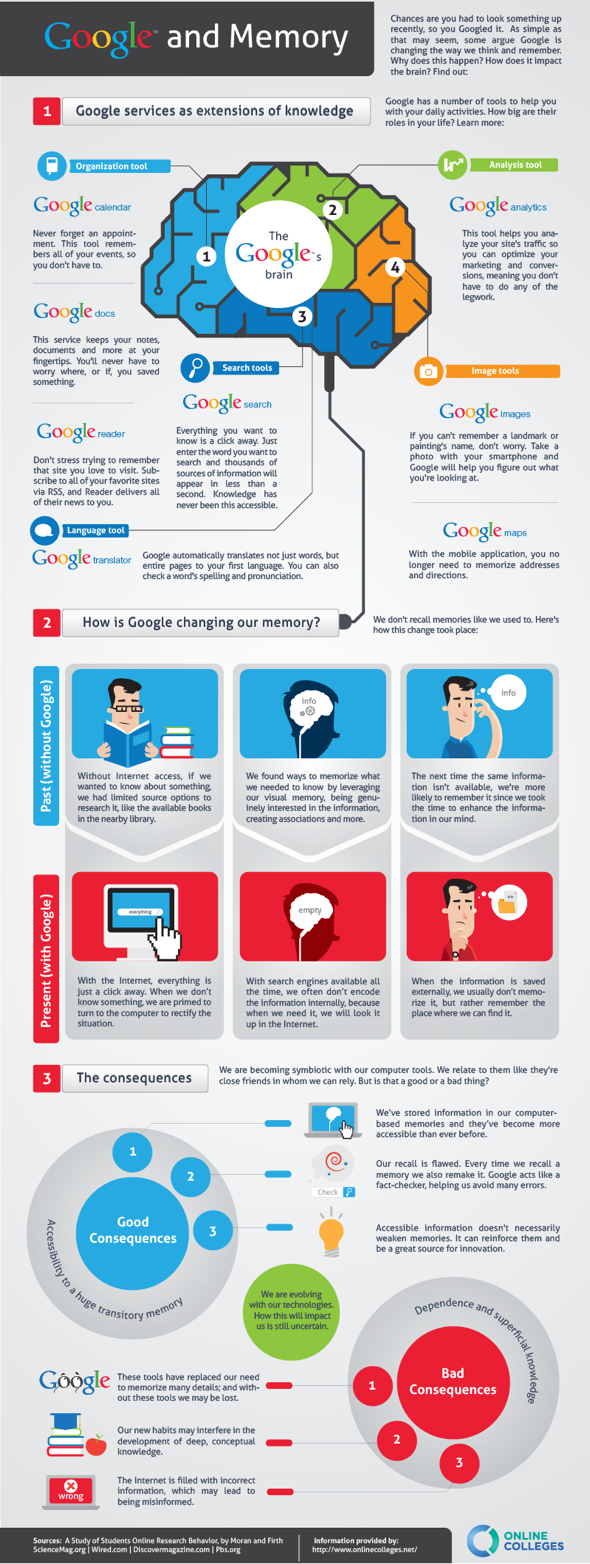
We all rely on Google search to find the truth on our current questions, right? Isn’t it scary in some way? Is Google becoming our brain in the future? What if you cannot find the answer on Google? We all use Google – and not only search. But do we use it too much? Could Google become an intelligence pitfall?

An interesting infographic by Onlinecollege.net on “Google and Memory” explains the impact Google has had and will have in our daily life in the future, especially on our collective memories. The infographic is well created as it separates “The Google’s Brain” into four separate quadrants. And all of us who use Google can see what effect this has on our habits… We don’t need our brain anymore it seems. Google give us all information: “just a click away”, “available all the time” and makes us remember where we stored the information we needed.

Will we forget to memorize? Will we lose conceptual thinking? Will we be misinformed?