Tag Archive for: Infographic

Target-group men: 10 Stats for better marketing

Obviously, there is a difference when targeting men and women. Their purchase behaviour differs in many ways. Who is searching more for coupons, bargains or the latest gadets? According to a report by Microsoft, marketers should have an eye on the right mix between banner advertising, search engine optimization (SEO) or pay-per-click (PPC) tactics in order to address and find men at the right time with the right content in the right context.

Many men, especially young dads (between 25 to 40 years), are influenced by the impact of social networks, according to the report by Performics which we reported quite a while ago. Interestingly enough, 58% of them use four or more sources for their purchase decision. Utilizing social media with story-telling about products and services will make the appropriate impact on men, will give them insights on how companies and brands against their competitors.

Check the infographic published by Brian Honigman and have the 10 stats in mind for the next marketing campaign or tactics when addressing the male audience when your business wants to influence the purchase behavior of men.

PS: If you are interested to see the difference to women, you might have a look at the latest Blogher study here

Target-Men-Marketing-2013

Serious Business: Facebook on mobile (Infographic)

Many companies and brands still don’t understand the importance of Facebook and how it gets driven via mobiles. However, some numbers put together by the guys at Qwaya indicate how serious decision makers should take the Facebook mobile business. The engagement of the web world turns towards mobiles, whether smartphones or tablets, and it is time to understand that Facebook cannot be taken out here. It might affect your business and the way people engage with your brand as well. Just open your eyes…!

Facebook-Mobile-Qwaya

How the Edgerank drives your Facebook marketing (Infographic)

Many people might have heard about the EdgeRank that drives the Facebook algorithm. It is the basis for the relevance of accounts and status updates, and yes obviously the users. However, how does it work is still an unchallenged question…

The aim of the Facebook Edgerank is to detect the updates people are most likely to engage with. One of the reasons why we sometimes don’t see our friends but those who are sharing updates that other people might like a bit more than others.

Some social experts suggest different types of posts that generate most traffic and engagement. Some believe in video, some in photo, and again others think that pure text is driving the algorythm most. Or is it the color that drives the customer? So, what is right? The answer is, only some people inside Facebook probably know that. It appears to be one of the well-protected next “Coca-Cola-like” secrets…

In the end, the only answer that we see is the quality of posts. They might be short or long, with or without audio-video content, and also might have a picture, or not. Not the type of post makes the difference. It’s the understanding of your audience, and there social media monitoring is the key to all social business strategy as these will lead to your success.

PostRocket just recently published a detailed infographic on the Edgerank topic. It is nicely explaining how this algorithm drives your Facebook marketing.

PostRocket 102

By age 2, 90% of kids have used computers

The Rasmussen College recently published an infographic explaining the tech development stages for kids. It highlights the main milestones in the development of media use of kids. he infographic and figures are based on studies from Common Sense Media, Ipsos and different other sources. The stats are eye-opening in a way that 90% of kids have been in touch with a computer by age 2. Even more by the age of 5 years, half of children use computers or tablet devices on a daily basis. It is astonishing how young kids are when they get into the tech world, and it seems that the tech touchpoint age is getting younger and younger.

Thinking about my boys, it might be even younger with smartphones and tablets…

Tech Kids Rasmussen College

Tech Kids Rasmussen College

Omnichannel Loyalty, and what it can do for companies…

What is Omnichannel Loyalty (OCL), you might ask yourself? Well, according to a Kobie Marketing infographic it is “an enterprise-level initiative to drive, track, measure, and reward incremental behavior throughout the enterprise and customer experience”.

The OCL approach defines how companies and brands engage customers with personalized messages at different touchpoints and various channels. It offers rewards for customers’ loyalty with the hope for lifelong brand loyalty. However, the challenge is, not to ignore the big data basics that are needed to drive an OCL business. The infographic shows that just 10% of real-time data is effectively used which states missed opportunities.

The infographic also makes clear that companies need to offer customers the appropriaste content in the right context with the right data approach in order to best engage the social customer who is “always addressable”.

Omnichannel Infographic

InMobi Global Study: Mobile media consumption outpacing TV, mobile ads drive sales

In prepapration of the first dmexco Night Talks moderation in Hamburg on “Mobile: The new first screen: reach, engage, measure, monetize”, sometimes studies fly into my mailbox which are reaching me just at the right time.

InMobi released their second wave research report on Mobile Media Consumption at Mobile World Congress. It covers some on-going overview on 14 countries on how we consume mobile content these days, and it obviously underlines the rapid growth of mobile media and the benefits of mobile advertising around the globe.

From a global perspective, mobile has reached the sweet spot in media consumption. It will generate its growth in the coming year predominantly via social media, search/download apps and search activities. In the 14 countries, humans spent from 7 hour media consumption (apart from other channels)…
1. Mobile 1,8 hours
2. PC 1,6 hours
3. TV 1,5 hours

The research piece shows that 50% of the average global mobile web users primarily use their mobiles now to go online. The average mobile web person uses 6.5 apps throughout a 30-day period.

But what does this mean for marketers?

The study states that globally, 54% of users discover mobile ads via apps, 40% on a search engine, 27% on a retailer website and 23% on a video website. It also makes clear that mobile is the touchpoint for finding new products and services. 3 out of 4 say mobile advertising has opened doors to something new. Almost every second say mobile ads have influenced them to buy mobile (46%) and almost the same amout (45%) say that mobile has mobile ads have influenced their purchase decision.

When seeing mobile ads, it is not that users don’t take any actions. It is actually the other way round. Mobile ads let users downloaded an app (80%), visit the advertiser’s website (67%), visit the store/retailer/business for additional information (52%), locate an advertiser on map (45%), or even take an immediate phone call (37%).

Mobile Media Consumption InMobi 2013

Spot On!
While I still have some marketers from media houses and brands in my ears, saying that apps and mobile ads don’t seem to be the right marketing approach, it seems they just did not find the right content approach to their users. The mobile commerce world is growing at speed of light and innovative retailers and brands should be well-prepared for it – and ideally have at least a click-to-call solution on their mobile website. It is not surprising that in these 14 countries 80% retailers say they plan to get the right approach to mobile in 2013.

How about you? Are you prepared for the mobile sales and marketing development? What experiences do you have so far with mobile ads?

PS: If you are interested in attending the dmexco discussion in Hamburg, please book your seat here.

BlogHer Study: Are woman the mobile 'Generation Now'…?

Millennials book their flights, hotels and probably would love to buy their drinks via their mobiles. They all get information in realtime. And the rest of the world? Do they also have acces to the world’s latest buzz, deals and chatter? One of the latest studies by the media network and publisher for women BlogHer states that our dependance on mobiles is massively increasing. Women manage and engage via our mobiles in all aspects of life – not important which generation it is. And if they don’t know, how can we know…?

They released some infographic that summarizes the results of their second annual consumer electronics study from December 2012. The stats are showing that we are all the mobile generation now. The study wanted to know when women of different ages usually buy electronic gadgets, what they love most about mobiles but also if fears accompany their mobile dependence.

BlogHer Study 2012 Mobile Gen

From these findings, they define three female mobile profiles…

The Recession Millennials (18-27 years old)
Unsurprisingly, Blogher describes Millennials as mobile natives. However, money stands in their way from diving into their early adopter reputation. Main fear? Their mobiles get stolen! Still, they are 31% more likely to “use a gadget until it doesn’t work anymore.”

The Gen X Early Adopters (28-45 years old)
The power-users and consumers are coming from the Gen X age. They love their mobiles for its capabilities to “do it all.” Standing between life and career, 25% said mobiles make them being more likely to be too distracted to focus on their family.

The Boomer Bargain-Hunters (46-64 years old)

Boomers want gadgets, but not for every price. They love hunting for bargains – and can wait 12 months for technical gadgets. Mobiles are their heartbeat. Still, data privacy has become one of their concerns.

Our question would be if this is not very much stereotyped. Or do you agree with this picture of the typical woman at different ages?

Mobile is maturing. The only question is "In which way…?"

Are we not all awaiting the “Year of Mobile”? Obviously, tablets and smartphones have made it become more sophisticated. However, most marketers still do not know how to approach this evolution from a strategic perspective. Understanding the bigger picture seems to become a leadership task. Who is using mobile tools on a daily basis? What are mobile business goals? Why do our employees need mobile and BYOD? Why is there an opportunity in using mobile to speed up business processes?

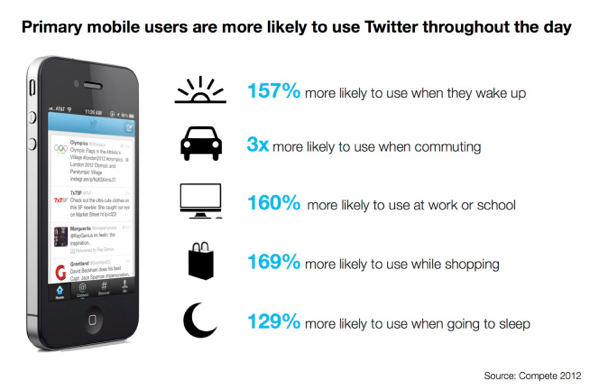
A new study by Compete describes for example who “Primary mobile users” on Twitter are. 57% are less likely to log into Twitter from their desktop than the average Twitter user. They check their updates and tweets more frequently than most other users. With 86% they are more likely to be active on Twitter several times a day than the average user. Smartphone apps are their entry point. However, 15% of the Primary mobile users” work on Twitter via their tablets predominantly.

Twitter Competer 2012

Furthermore, Mutual Mobile have created an interesting infographic which might offer some more insights, why enterprise mobility is essential for business development, where processes might get more impact through mobile, and how a company’s ROI might get the right boost with mobile.

Looking at the stats, it becomes obvious that the mobile priority increases with Chief Technology Officers (CTO), apart from dedicating greater resources to the mobile evolution when 94% of CTOs believe enterprise mobility will be important. Furthermore, 67% see mobile having more impact than the Internet did in the 1990s. Most important from an employees outlook is the fact that 65% understand more mobile support for employees as a critical priority.

Each and every business decision maker should see that mobile business leverages employees’ productivity (2X), quadruples margins and decreases customer churn by 20%. Private and business users are getting more and more engaged in mobile Internet activities. Mobile is maturing, the infographic states. Would you agree? And if so, do you have some more arguments why…?

Infographic_MutualMobile_Maturity_2013

Study: Big brands could do better on social customer service

Some weeks ago, we have written about the importance to be fast on response time on Social Media platforms. We made clear, based on some research by Convince & Convert, that companies need to react in not more than 60 seconds on complaints, customer enquiries and questions that appear on company’s and brands’ social platforms.

Now, a recent study of some of the biggest brands in the U.S., like Coca-Cola, McDonalds, Visa or Starbucks shows that providing a top standard of customer support on Twitter is not really as fantastic as it seems. Although some readings of all those good posts about these brands and their Social Media efforts might assume the companies do whatever they can in Social Business terms.

In the study, four Software Advice employees used their personal Twitter accounts to address customer service tweets to 14 consumer brands in seven industries – McDonalds, Starbucks (Fast Food), Coca Cola, Pepsi (Soft Drinks), Visa, Mastercard (Credit Cards), Wells Fargo, Bank Of America (Banking), Walmart, Home Depot (Retail), Apple*, HP (Consumer Tech), Gillette and Colgate (Personal Care).

They sent each brand’s Twitter account one tweet per weekday for four consecutive weeks, from “Urgent, to Positive/Negative, or questions about FAQ or technical issue. Then, brands were evaluated on their average response time and rate. See the results in the following infographic…

2012 Internet & Mobile Trends (Infographic)

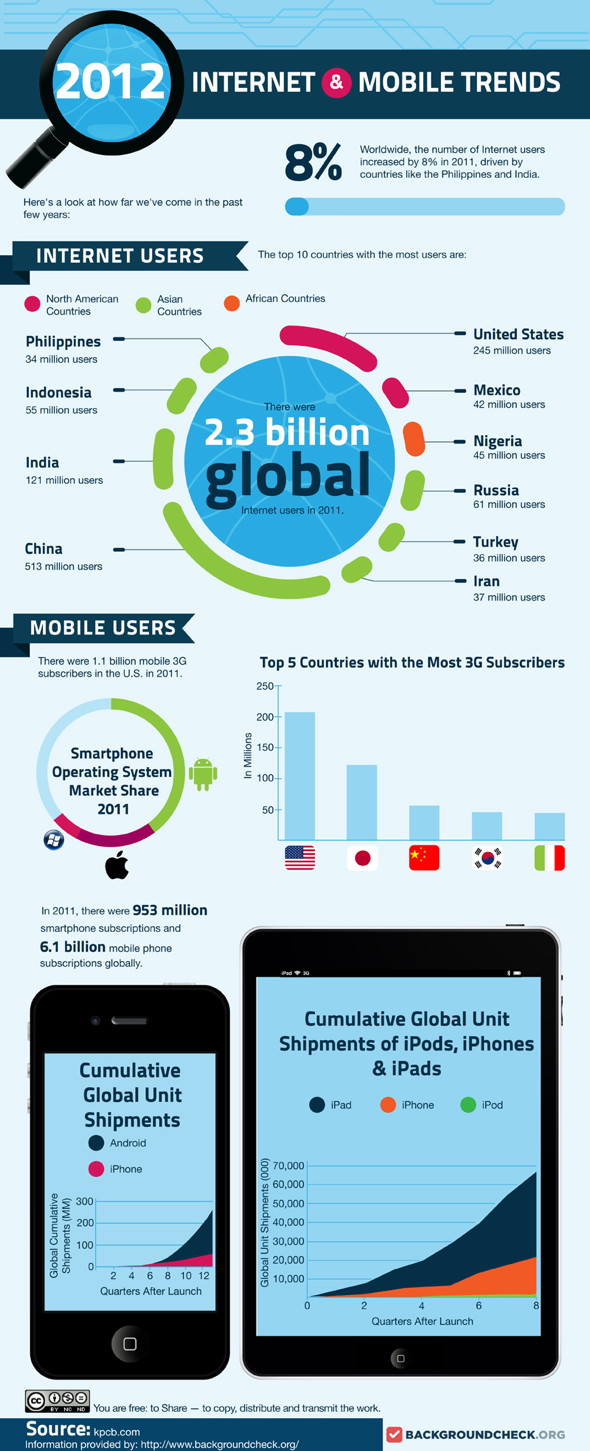
The year 2012 shows an impressive growth of the Mobile Internet, especially in the developing countries. The desktop loses more and more control, and shows an increasing shift to smartphones and mobile devices. The trend towards mobile Internet access and the mobile workforce cannot be stopped any longer. It offers some massive opportunity for businesses if they are open and think about how to approach the mobile freedom of the mobile workplace. More latest trends were uncovered and collected by Background.org in this infographic.