
Report: How Mobile Apps Monetize
One of the questions, we often get is… What kind of apps make money? Now, an interesting recent report by Distimo and Chartboost based on data from 300,000 apps worldwide with 3.8 billion downloads per quarter sheds some light here. In the Apple App Store free mobile applications with in-app purchases (IAP) get most revenue. The report shows that in-app purchases from free apps went up from 46% to 79% in the United States in only two years (Jan. 2012 to Jan. 2014). The leading countries in this app revenue context are China and Japan with the biggest revenue share (94%) generated from freemium business models.

Not surprisingly, Germany is one of those different markets again. Here, just 70% of Germany’s revenue was generated from free apps with IAP. The report makes clear that in Germany a bigger revenue share comes from paid business models. However, this is based on the evolution of efficiency enabling tools such as education or navigation which seem to be tools that the German population uses predominantly.

The APAC region shows the highest average revenue per download (ARPD). The leader being Japan with an average per download revenue of $5.32. Japan gets followed by Australia $3.60 and South Korea $3.40 places two and three. Canada, Germany, United States and United Kingdom almost generate the same amount per download of around $2.30. China came in last with an ARPD of just $0.92.

Still, this does not mean that the profit is as high as it sounds. In order to figure the profit out, Distimo and Chartboost compared the revenue per download (ARPD) to cost per install (CPI) for the leading 250 apps in the games category in 4Q13. Here, the winners were Japan before Australia, South Korea, the United Kingdom, and the United States.

The report shows that there is still money to be made. However, the cost per promotion in the App store or outside the app store should be calculated in. And then, the figures could look massively different…


 In an interactive infographic called “The Unruly Viral Spiral”, we get to see the value of social video and what it has achieved in the last eight years from 2006-2013. The graphic visualises that the top three branded videos have massively increased in shares. Since Old Spice had their massive success the top three brands have seen an increase of 613% since 2010. Interestingly enough, this year beats all records. 40% of the top 20 videos of all-time came out this year. From these, the leading ten generated 28,8 Mio. shares (an increase by 52% since 2012!).
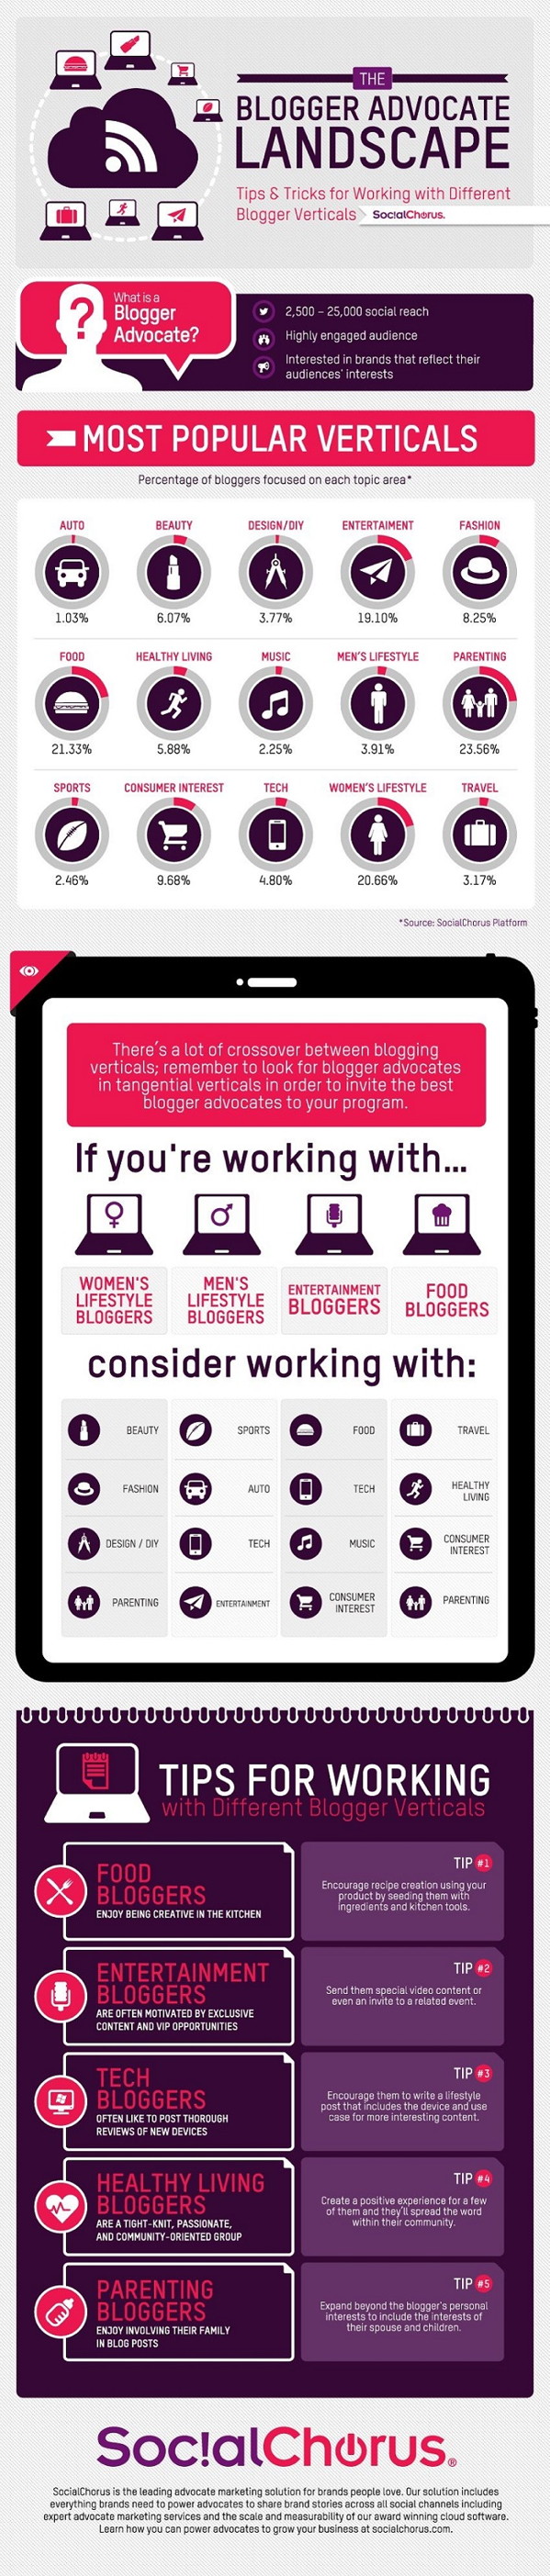
 In order to demystify the myth around social influencers, brand fans and brand advocates, we will discuss the topic in the future with different leading marketing specialist of emerging platforms and different cloud marketing providers.