Tag Archive for: Research

The near future of Augmented Reality (AR) and QR codes

Augmented reality (AR) has a glorious future according to a new market research published by MarketsandMarkets. It will be interesting to see which role QR codes play in that future as more and more technologies arise.

The new market research report “Global Augmented Reality (AR) Market Forecast by Product (HMD, HUD, Tablet PC, Smartphone) for Gaming, Automotive, Medical, Advertisement, Defense, E-Learning & GPS Applications (2011-2016)” states that the total Augmented Reality applications market will be growing by over 95% from 2011 to 2016. The research sees it reaching a market volume of $5151,74 million.
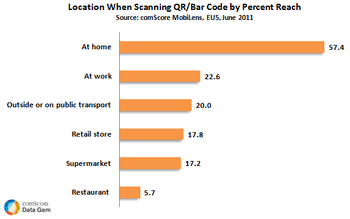
According to Comscore research almost 10% of all smartphone users have scanned QR codes in June this year. The interesting fact is that most users scan their QR codes from home (57,4%). In public only 20% use those QR scan options from outdoor advertising or in public transport.

Although screen technology (smartphone, tablet and eye-wear) is still in its infancy concerning AR, and also facing some challenges, the Universities of Washington and the MIT see a better future on the experience horizont. Especially, the head up and head mounted displays have become mature, finds the study. Leading and growing in use are online apps, gaming apps and GPS apps. So far, campaigns like the following by MIRAT Paris work on the basis of QR coding…

YouTube

By loading the video, you agree to YouTube's privacy policy.
Learn more

Load video

But what kind of Augmented Reality technologies are rocking the transformation from the physical to the virtual world, or shall we say to the mobile world?

Some months ago, we only had browser technology like Layar and Wikitude. Today, companies like Tesco are experimenting with other capabilities in their retail shops. For a long time, we had to use QR codes or trigger points to initiate some activity with AR technology.

Layar’s latest innovation called “Vision” is another reason why QR codes are becoming uncool. Vision is a tool that lets advertisers and content owners integrate Augmented Reality ads in publications. As an example you may watch the Dutch magazine Linda how the technology works…

YouTube

By loading the video, you agree to YouTube's privacy policy.
Learn more

Load video

Some other technology innovations are also evolving that might catalyze the technology shift in the AR sphere. Here are three of them…

Aurasma
The Aurasma technology -unlike the GPS based technologies Layar (until the Vision version) and Wikitude that merely recognizes what someone has tagged as locations or places- is a new generation augmented reality browser. Aurasma recognises images through cameras in a way search engines recognise words. The browser then creates so-called 2D or 3D „Auras“ which show animated audio-video content. Just watch some examples of Aurasma campaigns.

YouTube

By loading the video, you agree to YouTube's privacy policy.
Learn more

Load video

blippAR
With blippAR the whole advertisment becomes the response tool. It is enough to simply point in the direction of the ad with the app. Still, the awareness challenge needs to be solved. And, the need for a specific browser to use the technology. See some examples of blippAR usage. At the moment you can even participate in the interactive blippAR campaign “escape the map” by Mercedes Benz.

YouTube

By loading the video, you agree to YouTube's privacy policy.
Learn more

Load video

Printechnologics
Printechnologics is based on Touchcode carrier technology. It contains a blind or transparent code which is embedded via invisible data storage development inside print products like carton, foil or simply paper. Printechnologics turns the AR identification around as you lay the paper on top of the tablet or smartphone, and not the other way round. And you don’t even need to modify your device, download a browser, use NFC (near field communication), or a camera for it to identify and initiate the online activity form the offline trigger. The last issue from the ICONIST carried a Printechnologics card and here you can see how it connect the two worlds….

YouTube

By loading the video, you agree to YouTube's privacy policy.
Learn more

Load video

Spot On!
In some months, the QR codes might be gone as an AR trigger, and thus leave the advertising world. However, all AR technologies have one weakness: You need to know that these technologies are embedded in any forms of campaigns. You need some trigger point, button, picture, image or QR code that people see. Thus, the main challenge for QR codes and Augmented Reality is to build awareness and understanding what it can do. Nobody is using a browser or a camera if there is no “visual” reason for virtual interactivity. I see TV using any of the forms as an extension for their TV shows in order to promote their digital content and advertising opportunities, just like the print industry did in the past. One thing is for sure: Augmented Reality will definitely become a new playground that connects the TV and online markets in the future…

What’s your view on Augmented Reality and QR codes? Let us know…

Profiling the social customer (infographic)

If marketers are looking to understand the profile of a social consumers, they need to have deep insights into their souls and needs. Beyond Digital has asked 3,000 US and UK consumers about the two products and services they had most recently researched online and which steps take them through the purchase process.

Apart from showing gender differences, sharing becomes the main element of strategy. The social consumer is a two-faced personality: First, they can either be categorized as a high or low sharer. A human being that utilizes differtent digital channels in a different manner, depending on whether he or she is researching and interacting with high or low involvement products. Those with a high sharer profile are the most valuable for brands. They recommend products 3x more often and influence others’ purchases…

Study: Users „like“ brands for deals, discounts and coupons

Harald Wanetschka / pixelio.de

While Vitrue just found out how to get more “Likes” and engagement on mobiles, another new study by Nielsen/McKinsey’s NM Incite shows what the real value of “Likes” is. Although many brand marketers are working on the ROI, most companies still try to find some more value in the social engagement of consumers.

The Nielsen/McKinsey’s NM Incite global online consumers’ research states that the main reason for following or liking a brand or company on social networks is to receive discounts and special offers.
“While some may argue that consumers’ interest in discounts has faded, Nielsen data shows the desire for deals is still strong worldwide,” concluded NM Incite.

The results correspond with the study by ExactTarget and CoTweet from last year. The former study made clear that 40% of brand fans like a page predominantly for their doscounts and promotions.

The new NM Incite finds even higher figures. Almost 60% of US social media users visit social networks to receive coupons or promotions. And even more, 23% do this on a weekly basis. 45% of North American consumers had the strongest interest in using social media for deals, followed by consumers in Asia-Pacific (34%) and Latin America (33%).

Social deals hunters “Like” at home and at workplace
For most people it does not matter whether they are at home or at their workplace when using the benefits of the Social Web. A sample of ten major markets shows that nearly 40% of active Web users check coupons and rewards sites such as Groupon, Coupons.com and Living Social from home and work computers in September. However, there are respondents -under the age of 20 and 55- to-59-year-olds- who were less likely to follow brands for discounts. Here friends’ recommendations are the drivers for social engagement.

Spot On!
“Social deal hunters” are obviously also visitors of social networks and blogs. NM Incite found a strong overlap. In their test phase in September, 43% of visitors to social networks and blogs also visited a coupons or rewards site. And, 44% of Facebook’s audience and 63% of Twitter’s audience visited these deal sites. The study concludes that Facebook becomes a key source of traffic to Groupon and Living Social. Groupon’s and Living Social’s visitors came directly from Facebook. This also shows the link between deals and social networking sites, and how companies can motivate consumers to deals.

Innovation study: Is culture or strategy the key to success?

Obviously, the headline question is not easy to answer. Both elements have their impact on business success. At this years IBM JamCamp, we could hear many presentations why “culture eats strategy for breakfast”, and how to turn your business into a social business (i.e. Sandy Carter’s speech) that will drive innovation to new dimensions (and here is some hint how companies might get huge investments for social business realization).

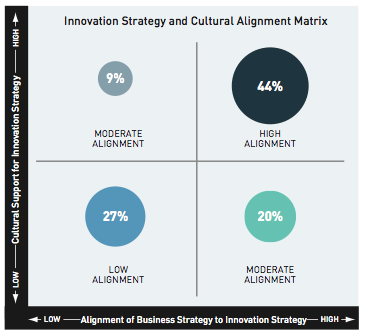
A new study by Strategy& also shows that spending more on R&D won’t drive results. The results from the study illustrate that the most crucial factors are strategic alignment and a culture that supports innovation. The study surveyed almost 600 innovation leaders in companies around the world, large and small, in every major industry sector.

So what makes a truly innovative company? For sure, a focused innovation strategy, a compelling business strategy, deep customer insight, intelligent networking, as well as a splendid set of bright tactics. These are all elements that help giving your company an innovation boost. Still, the study states that corporate culture ties everything together — the organization’s self-sustaining patterns of behaving, feeling, thinking, and believing.

Still, the results of this year’s Global Innovation 1000 study make clear that only about half of all companies say their corporate culture robustly supports their innovation strategy. Moreover, about the same proportion say their innovation strategy is inadequately aligned with their overall corporate strategy. And although entire industries, such as pharmaceuticals, continue to devote relatively large shares of their resources to innovation, the results are much less successful than they and their stakeholders might hope for.

What I like about this study is that it supports my assumptions and thoughts of the Community Centric Strategy model. Across the board respondents identified “superior product performance” and “superior product quality” as their top strategic goals. And their two most important cultural attributes were “strong identification with the consumer/customer experience” and a “passion/pride in products”.

Statements like the following from the study could be taken as a proof for the future development towards a more cultural business attitude that puts the consumer in the middle of your innovation efforts…

“Our goal is to include the voice of the customer at the basic research level and throughout the product development cycle, to enable our technical people to actually see how their technologies work in various market conditions.” Fred Palensky, Executive Vice President of R&D and CTO, 3M Company

In my presentation at the IBM JamCamp 2011 I made clear that companies and brands need to close the perception gap between consumer’s demand and company goals. If companies don’t respect the 5 C engines of the Community Centric Strategy these two expectations cannot be aligned. We will continue to talk of target-groups instead of consumers that are grouping together in “community centers”. This is more of a cultural development companies need to go through than definable strategic capabillities by companies to drive innovations. By closing both the strategic alignment and culture gaps, companies and brands will better realize their goals and attributes.

Spot On!
The study results show that companies and brands should rethink the way they drive their innovation strategy. It suggests that the ways R&D managers and corporate decision makers think about their new products and services are critical for success. This includes all aspects how they feel about intangibles such as risk, creativity, openness, and collaboration. When nearly 20% of companies said they didn’t have a well-defined innovation strategy at all, it offers the chance to start anew and with the right approach. The Community Centric Strategy might be one solution for companies to evaluate culture as one of the main drivers to achieve your strategic goals in a modern way of doing business.

Study: Twitter becomes popular among business chiefs

Is this a good sign for the acceptance of social media in the business world? The use of Twitter as a business and marketing tool has increased from 31% to 61% among Europe’s top business leaders, finds a recent study by CNBC.
Even more, 61% of the business leaders see the growing impact of Social Media. They believed Social Media was changing the way their business is done today. 77% of the business executives have Facebook accounts (from 81% in 2010). LinkedIn gains tracktion from 52% to 56%.

The study polled 650 European business chiefs as part of their CNBC Europe Mobile Elite 2011 survey. The idea was to get more knowledge about the use of the latest technology features in the C-Level area of companies at work and in their free time.

Although the increase of Twitter popularity among business leaders is obvious, the busiens decision makers admit that the are unable to keep track ith the latest technological innovations. Apart from that, another study some weeks ago showed that they are also not sure how to leverage Social Media for business.

The most popular device is the iPhone which 21% of the business chiefs call their own now – up from 19% in 2010. Similar numbers gets the Blackberry in terms of popularity – an increase from 18% to 20%. The iPad is also becoming more popular among business leaders, with 15% of them now owning one.

“In a rapidly changing world, Europe’s decision makers are challenged with not just keeping up with technology change, but also ‘driving change’ within their respective sectors. Throughout 2010, Europe experienced some the most advanced innovations in mobile technology the region has ever seen.” Mike Jeanes, Director of Research, CNBC EMEA

Spot On!
The CNBC study states the importance and changing development of mobile use for the business decision maker. The message is that websites will continue to lose value against apps on mobile devices among business leaders. News apps are the most popular application segment for the respondents. 75% of respondents said they use them followed by weather (54%) and social networking (39%). The study makes clear that top management is trying to get in touch and keep up with the pace of technology innovation. However, time still seems to be their biggest enemy…

Web or App? Nielsen study knows usage time of Android smartphone users

According to the latest findings of research firm Nielsen that tracks and analyses iOS and Android data, smartphone users spend twice as much time on applications than on mobile version of these websites. The study reveals also that –although there are millions of apps in the world- only “a very small proportion of apps make up the vast majority of time spent”.

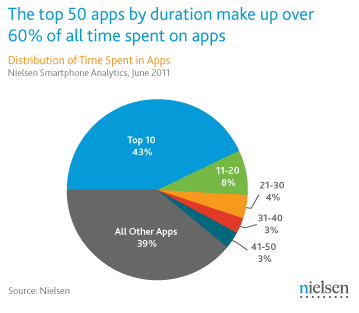
The average Android smartphone user spends 56 minutes a day using apps and browsing the internet. Two-thirds of that time is usage of apps, the rest goes to mobile websites and 39% acccount for consumer app consumption. The study illustration below shows that mobile device owners spent almost half of their usage time on their top 10 favorite apps and 51% on their favorite 20 apps.

Let’s give it a guess… Probably most of the app usage of mobile device owners accounts for the following usage time: Checking email apps, Facebook, Foursquare or Gowalla, Twitter, and some of their favorite and coolest news or geeky gaming apps (very often used by their kids). And if you look at the top (free) list of apps you find Angry Birds, Angry Birds Rio, Google Maps, YouTube, Facebook Mobile, Skype, Tiny Flashlight, Viber and Drag Racing amoungst others.

The study supports my own feeling that although we continue to download apps and spend (2010 per user: Android 1,97 USD, iPhone 21,22 USD), we only use most of them them periodically, and only a few continously if the give us permanent benefit in networking or staying up-to-date on news.

Well, the time will come when HTML5 might change the market situation and developers will have an easy time working with apps. Amazon’s Kindle Cloud Reader gives insights in what is possible with HTML5 for the mobile web.

Spot On!
The study does not really give an answer to the question yet, or can give a recommendation to management. Still, Seeing these numbers, just imagine the chances companies and brands have when launching a new app to get under the hiflyer apps in the smartphone user market. Ideally, think about the five strategic reason that could make your app successful and be aware of the fact that most brand apps fail.

News Update – Best of the Day

Although the mobile hype is massive, there are studies that question the power of smartphone mobile advertising and it’s efficiency. A new research from YouGov shows consumers accept placements as part of their day-to-day mobile experience but consider them intrusive (79%) and tend to ignore them altogether. Only 5% think mobile ads are a good idea and welcome them. However, the general apathy smartphone users have toward seems to equal ignorance: 88% ignore ads on applications and 86% have ignored placements on the mobile internet.

The security company Imperva released a study that states “web applications, on average, experience twenty seven attacks per hour, or roughly one attack every two minutes.” Imperva monitored 10 million attacks between December of last year and May of this year “targeting 30 different enterprise and government web applications.” Of the 27 attacks per hour most of them are trying to identify vulnerabilities on websites. If a vulnerability is found, attacks can increase to 25,000 per hour which would be seven attacks per second.

What is the future of Twitter? During a keynote interview at Fortune BrainstormTech in Aspen, Twitter CEO Dick Costolo gave insights in his vision of the company’s business model.

PS: Just in case you ask why Twitter is cool, Steven Winterburn has got the answer: “”Twitter is like a fridge. If you’re bored you keep opening & closing it every few minutes to see if there’s anything good in it.”

Study: Will the traditional office be extinct by 2021? Yes, say 58% of UK workers…

Rainer Sturm / pixelio.de

How long will we continue working in traditional offices? How long is commuting still a must to keep a good job? A question that I got asked quite often in the last months. My view is, it won’t take another decade to understand that there are several ways to establish a new and more efficient work-life balance instead of commuting in the office every day. However, I see many challenges for our social society when thinking about jobs and social engagement

A recent study by Virgin Business Media now shows some similar insights. It states that 58% of U.K. workers think offices of today will not exist in ten years’ time. The study was commissioned to celebrate the tenth anniversary of the British sitcom The Office (basis for the U.S. show).

The findings are based on a research that surveyed 1,000 U.K. workers that gave feedback on how their working lives have changed over the last ten years, and how they expect them to change over the next ten years. It has to be said that it was predominantly based on the impacts of technology…

Working remotely will be the new trend. Commuting and traditional offices will be out soon. At least that is what UK workers predict: 56% of respondents are not seeing themselves commuting in 2021 like they do today. An impressive 83% respond that technology enables them to become more productive in the last ten years. Productivity in the future means (62% say so) they would use just one device to handle both their personal and work life in ten years’ time.

The question will be if people will want to work from home, or prefer to continue commuting. Having someone to talk to, not being forgotten and having a need to show somebody that you are really “at work” might be reasons against the future outlook with no traditional offices space.

Spot On!
In May a report from Regus and Unwired called VWork: Measuring the benefits of agility at work makes clear that only 12,3% of respondents want to work from home. It will be interesting to see whether companies offices will extinct, or if companies will give their employees money to find coworking space (like the car allowance concept), or if they host coworking space (in order to recruit new people…). The virtual office will be the future for many people. I just can see lawyers, controllers or HR people who might need their traditional offices. The rest will be able to work remotely… It is more flexible, more agile for marketing, sales and business development, and people are motivated to have more meetings.

Would you agree? Do you see this development as dangerous? What is your view on the extinction of office space?

What happens in 60 seconds on the Social Web? A comparison and the value of "infographics"…

There are different ways to illustrate how fast the Social Web is growing these days. For two years my favorite “real-time” resource -based on studies and research data- was Gary Hayes Social Media Count. And I am sure, you have all seen this great little widget already…

However, we also have to keep up with the pace and realize that -although people already hate them- infographics are sometimes a nice way to grab facts quick and easy. The Shanghai Web Designers created an infographic which illustrates how fast conversations, comments and content are produced on social networking and online platforms in only 60 seconds.

60 Seconds - Things That Happen On Internet Every Sixty Seconds
Infographic by- Shanghai Web Designers

Now, although I honor the work of the Shanghai Web Designers, it lacks some information on where the data was generated from. Gary Hayes explains nicely how the app data was put together and how actual it is (having said that I think Gary needs to refresh his links as I found links ending in 404’s).

A comparison could be interesting, I thought. Why not compare the 60 seconds data from the Shanghai Web Designers (SWD) versus a “one-minute-momentum” of Gary Hayes (GH) counter…? I started the counter and waited 60 seconds, and there you go. Here are the results…

The comparison will just focus on the essentials Google, Email, Facebook, Twitter and Youtube. You can still do your own comparison afterwards…

Google
Search queries: 694,445 (SWD) versus 1,393,519 (GH)

Emails
Emails sent: 168,000,000 (SWD) versus 204,255,455 (GH)

Facebook
Status Updates: 695,000 (SWD) versus 696,758 (GH)
Comments: 510,040 (SWD) versus 512,100 (GH)

Twitter
New accounts: 320 (SWD) versus 208 (GH)
Tweets published: 98,000 (SWD) versus 62,707 (GH)

YouTube
Hours of content uploaded: 25+ hours (SWD) verus 36 hours (GH)

LinkedIn
New members: 100 (SWD) versus 60 (GH)

Spot On!
The comparison makes clear that the Facebook figures are similar whereas for the rest of the figures there is a massive discrepancy in numbers. Facebook is sharing their latest actual figures, for the other technology platforms the data probably comes from third party sources (or at least as far as I can see). If all platform and technology owners would share their latest data, those discrepancies won’t happen. The lack of source information from Shanghai Web Designers makes it difficult to argue which data is the latest, where the differences in the comparison are coming from, and so on. Maybe this is the reason why some experts don’t like infographics any more. “Don’t like…” might be wrong when I see how many people have shared the infographic in the last days. They appear very nice and compelling in social networking accounts and “illustrate” thought-leadership in presentations. Right…?!