Tag Archive for: Google

Study: Online forums still popular and leading community option (Infographic)

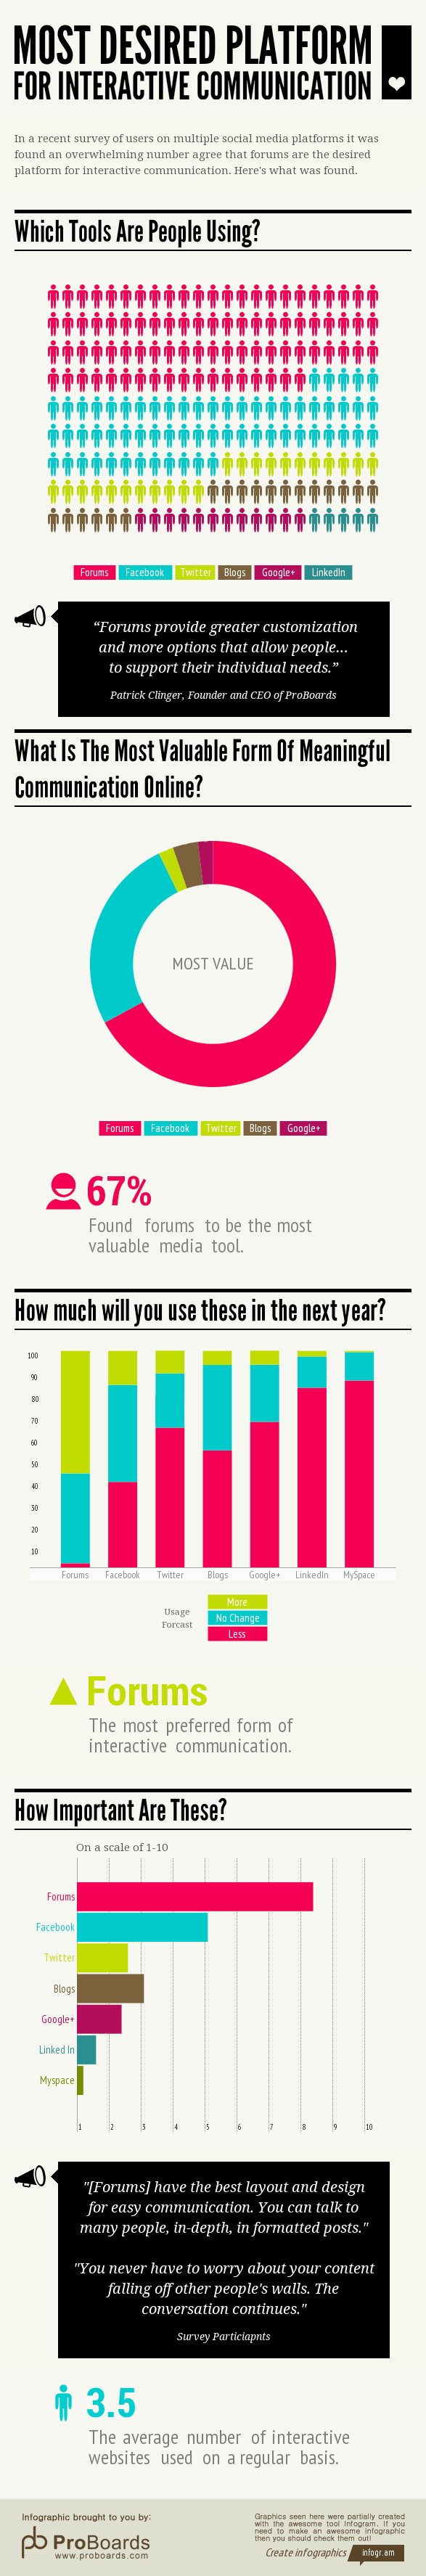
According to a recent “2013 Social Media Survey” by Proboards the interactive communication preferences across platforms are still heading towards forums. Although you might think that they asked their own users (which is probably right), the survey still shows the importance of forums and communities. For their results the company promoted the research toover 150 respondents via Facebook, Twitter, and the ProBoards customer support forum.

The study claims that online forums are still popular. What was interesting for me to see is that they were even preferred compared to social media platform for interactive communication. Two out of three respondents (67%) stated that forums were the social media tool they found most valuable. Obviously, Facebook, Twitter, blogs, and Google+ follow but the question here could be asked whether most people realize that all these platforms are also forums if used in the right way. That LinkedIn did not figure in as a significant social media tool is in my eyes not correct as the forums there within, are very powerful and interactive, plus they generate very valueable input for managers.

“The survey results do not surprise us since platforms such as Facebook and Twitter do not give you the level of control that forums do,” said Patrick Clinger, founder and CEO of ProBoards. “Forums provide greater customization and more options…”

Forums -although we would define them as communities according to our Community Centric Strategy– offer a great way of engaged communication, and probably with better and deeper quality than any other social network. There is more information in the infographic attached…

ProBoards-Social-Media-Study-Forums

Study Search Ranking: What makes your brand look good on Google

It is one of these questions that many brand marketers are asking themselves: What makes us reach the top search results on Google? A recent report based on Searchmetric data for 10,000 top Google search keywords sheds some light here. It was based on correlations and website characteristics of 300,000 URLs appearing in the top search result position in the US between March 2013 and June 2013.

The report shows that those websites tend to perform best that have a high social impact in terms of likes, shares, tweets and Google “+1″‘s. It also makes clear that there is a realationship between ranking high on Google and collecting Google+ links to achieve better ranking impact which the graphic below indicates.

Searchmetrics-Rank-Correlation-Facts-Social-2013

Despite common believe that fast website performance through intelligent on-page coding might create some benefit for the search ranking, the study shows that just not having it will let websites achieve lower rankings. This means that SEO basics like having H1 and H2 tags or providing brief descriptions now are seen as standards but won’t support any boost effect.

Searchmetrics-Rank-Correlation-Facts-2013

Still, content is king for Google. Good rankings were correlated always positively with good and unique content and had a bigger effect in 2013 than the year ago. As main ingredients of positive content can be named a clever internal link structure, a URL with a clear message and longer text plus a sensible number of integrated (audio)-visual files. This could be as of the fact that Google wants to boost their own pictures search sites and obviously Youtube.

Keywords keep up their impact on the rankings. On the page, they still need to placed in the title as close to the front as possible and in the text they need to be placed wisely as well. As of some algorithm changes compared to 2012, the importance of keywords in the domain name or the URL has lost its significance.

According to the report, websites of brands and other domains seem to play on different levels for Google. Obviously, brand websites seem to be superior to normal sites. The report states that it looks as if the search engine finds it normal for brands to generate more backlinks with the brand name appearing in referring content pieces alone.

The infographic provides some more information – and if this version is too small, just click here and download it
Search-Ranking-Factors-2013

Study: Increase in marketers social spendings expected (Infographic)

With their recent study The Creative Group predicts that the majority of advertising and marketing executives (62%) expect an increase of their company’s spending on Facebook marketing in the follwoing twelve months – 9% more than they predcited one year ago.

Not surprisingly, the advertising spend on Facebook leads the list of social ad spendings. However, the majority of executives will also invest in other channels more than last year: LinkedIn (51% up from 38%) and Google+ (50% from 41%). Twitter is also on the plan for a budget increase with 48%, as well as Youtube (40%), Pinterest (35%) and Instagram (32%)

Although this shows a great breakdown of all industry sectors and job titles in an overview, the different industry segments and job titles varied in their view on budget increase:

Facebook
– Large companies (100+ employees): 74% of marketers expect an increase in Facebook spend
– Smaller companies (100-249 employees): 60% predict an increase for Facebook spendings

Twitter
– 57% of advertising executives expect an increase in spendings
– 48% of marketing executives expect an increase in ad spends
– 12% of marketing execs expect a decrease in spend
– 6% of advertising executives expect a decrease

The study was based on a US survey of 300 marketing executives and 100 advertising executives.

How about your marketing budget planes with Facebook, Twitter and the likes? Increase or decrease?

Forecast-Social-Media-Spend-2013

The Google Graveyard (Infographic)

“I think all great innovations are built on rejections.” Louise Berliawsky Nevelson

Although Google has been one of the innovation rock stars as a web company for years, it also had it’s nightmare. And nightmares usually end someone on a graveyard. The list is long and the guys from WordStream created a nice infographic which reminds us what did not work them.

The latest product that -despite a very intense but small fan group- did not make it, is Google Reader. But also other products that looked promising were laid to rest: Google Talk (instant messaging ended May 2013, however Google+ Hangouts is much better), Google Buzz (social networking ended Dec. 2011, messaging tool and microblogging) and Google Labs (ended July 2011, formerly called “a playground where our more adventurous users can play around with prototypes of some of our wild and crazy ideas, and offer feedback directly to the engineers that developed them.”).

Google_Graveyard

Google_Graveyard

Spot On – How to write the perfect post (Infographic)

It is something we keep being asked seminar after seminar. What is the perfect status update looking like on Google+, Facebook or Twitter? Well, the answer is there is no secret sauce. Or maybe there is now? The guys from Mycleveragency have at least try to define it and put in as much knowledge as possible. If it helps when all tweet and chat on social platforms at the same times, I might doubt here but still…

PerfectPost

How the viral video web world is emerging (Infographic)

Audio-video content and video content networks are on the rise. Not one company in the FMCG industry that did not try to start their own initiative around their brand or product in the last two years. From the hype of Social Media another hype was creaping up that many have not yet fully understood but think it might change the world of the advertising industry in the future: viral videos.

The advertising business hopes to make money through Youtube channels and the Google AdSense business. Google invested 100 Mio. US Dollars in the launch of new and original TV content for their Youtube platform, plus they built production studios in London, Los Angeles and Tokyo which might build up Google’s audio-video channel to become one of the main challengers for TV.

Next to the increase of vimeo traffic, more and more video advertising companies arise that produce content, media houses create content hubs as well as PR agencies. Obviously, social advertising companies like Unruly, hallimash or ebuzzing are doing their best to get bloggers implementing and writing about viral ads that their brand customers create. And in the end, the Social Star Awards will make all marketers happy when their virals have made it to become a “viral star”.

The following infographic by the Masters in Marketing Degrees offers some statistics on how the viral web video industry has emerged in the last few years.

The Economics of Going Viral

Mobile Advertising: Performance gets better, and Google takes 50% of revenue

mobile-webThere are different views on why mobile advertising is performing. However, some new studies might spread some light: one form TNS and one from SessionM which did their study in cooperation with Millward Brown. The study SessionM published today shows that consumers react positively twice as often to mobile ads… but only as long as they get some value out of it.

Mobile banners are most used from smartphone owners when they get a gift card, coupon, events tickets or loyalty points. Although this gives some good insight in the ranking of the preferred mobile engagement options, consumers want to know what benefit they get out of the digital experience. It means that marketers need to be clever and having some good approach. The surveyed consumers replied that the way mobile ads are presented was crucial to their feedback.

The study makes clear that the mobile strategies need to be clear to the consumer, said Lars Albright, CEO of SessionM: “The questions are, ‘What value am I bringing to the consumer?’ And, ‘How am I doing it?'” It asked 1,000 consumers in a digital survey, as well as a dozen participants in each four hour interviews. 93% of respondents said they had the opportunity to choose a reward in exchange for their smartphone time was “important”. This comes as no surprise after the latest Adobe study telling us that often digital advertising is found “annoying”.

The difference between rewards-based mobile ads and different types of on-the-go promos was that rewards-based mobile ads performed better for purchase consideration (+65), the brand in brand interaction (+14%), branded website traffic (+13%), web searches (+8%), in-store shopping for the brand (+6%), and approaching the brand’s social media pages (+5%). Obviously, the user can be handled and does not always see banners as “annoying and invasive”.

Finally, while a lot of industry players see location-based services as the key to mobile’s future, Joline McGoldrick, research director at Dynamic Logic, Millward Brown’s digital practice, spoke about how interest-level marketing can be a huge help to the space. “Targeting is getting better in mobile,” Joline McGoldrick, Research Director at Dynamic Logicsaid, “but it is still not perfect.”

eMarketer 2013
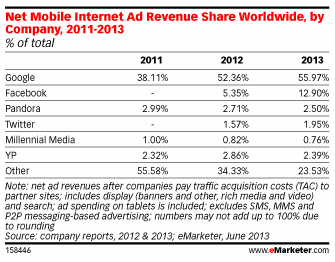
Now, although mobile ad revenue is far from reaching big amounts of ad spendings, many marketers see it as a growth area. Whatever the number that is attached to total mobile ad revenue worldwide is, Google is the leader with over half of surveyed people according to eMarketer. And if you see the numbers it seems that Gogle is still not happy with the budget chunk they do get, reaching out for more it seems. But also Facebook investors will see some light at the end of the tunnel with mobile ads on the rise. However, Google might like the competition but all that market dominance simply making way for some more challenging competition.

It will be interesting to see who will come up as the leader in this cmpetition, who can compete with Google in general, and will Google continue to grow their business? You tell us your views….

Digital Content, and some stats how we use it in 2013… (Infographic)

Digital content readership is changing massively. And the guys at Uberflip have done some research around how data was used between February 2010 and February 2013 via Google Analytics and Uberflip Metrics. The infographic that highlights their findings shows how much mobile content usage and consumption is evolving, as well as how much content is shareable.


From a global perspective, mobile content consumtion in terms of visits makes up 21% (from 1,6% in 2010) while desktop traffic is decreasing continously. But mobile is not the only winner in this field. Video is increasing massively as well since 2010: 22% (from 6% in 2010) of internet users are putting video into their content portfolio.

People also change their way of sharing content these days. While in 2010, users were used to sharing their content via email, in 2013 the figure of sharing content via email went down to 53.3% in February 2013 (from 93.3% in 2010). Facebook and Twitter seem to be the big winner here: 27,4% of people are sharing content via Facebook (compared to 3,4% in 2010), and 9,7% via Twitter (compared to 0,5% in 2010).

uberflip-DigitalContent-Consumption

Study Mobile Search: How it drives activities and conversions online and offline

We all experience on a daily business how mobile devices are changing our world. Mobiles become more and more our shopping companion, and with it mobile search becomes more and more popular to satisfy our needs. Google and Nielsen cooperated in a recent report to illustrate where and how people use mobile search, and what purchasing behaviour results from it.

Most mobile search activities happen in the afternoon and evening. However, the activities happen at home (68%) and not from “on-the-go” (17%). The driver for the activity is 81% the need for “speed and convenience”. Funnily enough people believe that doing a mobile search at home is easier than opening the computer (83%).

Google mobile search drives on and off

Concerning the types of mobile search, it varies still. People tend to do food and shopping “in-stores” versus finding travel information which is done from their office or while on-the-go. The interesting finding for marketers is that these searches drive users to do additional activities. 73% trigger additional actions after doing their mobile search.

Google mobile search triggers

The study makes clear that mobile searches are pushing fast online and offline activities. More than half of all mobile users do call a business, make a purchase and visit a store in the short time-period of only one hour. Furthermore, mobile searches becomes more and more impactful for businesses. Mobile searches trigger consumers for additional actions and conversions (73%). The respondents of the study also visited a retailer’s website (25%), shared information (18%) and visited a store (17%).

Google follow-up activities mobile search

Spot On!
Although this study might have some Google touch, the reports offers some good insight into the offline and online world and how it gets driven by mobile search. We should not be surprised to get further new mobile products from Google for users (mobile value-add) as well as for marketers (mobile ad products).

Which products would you like to see from Google for mobile search that don’t exist yet?

Report: comScore unveils insights in main mobile development for 2013

comScore Mobile 2013In a recent report called “2013 Mobile Future in Focus” comScore released their outlook for mobile trends. The report shows the U.S. mobile and connected device landscape in 2012, which is meant to the set the stage for the international expansion of the mobile revolution. It offers insights into mobile media consumption, mobile networks, platforms, as well as OEMs. It also includes key mobile market insights from the United Kingdom, France, Germany, Spain, Italy, Canada, and Japan.

The report illustrates the following trends for the mobile year 2013…

Multi-mobile use shapes the “Brave New Digital World”
The U.S. is surpassing 125 million U.S. consumers and tablets in mobile consumption. More than 50 million own smart mobile devices which make consumers being always connected. Americans spend more than one out of every three minutes online on mobiles. Does this show the end of the desktop?

Smartphones surpass 50% penetration and start ‘Late Majority’ of adopters
In 2012 the U.S. smartphone market became the year of mobile by finally surpassed 50% market penetration. It enters the “late majority” stage of the technology adoption curve. Smartphone subscribers increased 29% from a year ago and 99% from two years ago. 72% of all newly-bought devices were smartphones.

comScore Mobile 2013 Smartphone Tablet Ownership

Android and iOS Control U.S. Smartphone Market
Google’s Android OS and Apple’s iOS dominate the U.S. smartphone landscape with almost 90% of the market today. The well-developed app ecosystems makes it even more difficult for competing platforms to narrow the gap.

Samsung makes splash in smartphone OEM market
Samsung strongly competes more and more with Apple that is still the leading smartphone OEM. The year-over-year increase of more than 100% from Samsung and a two-year increase of more than 400% shows how much they are challenging Apple. The gap between the two competitors is steadily narrowing though.

High-Speed mobile connectivity speeds up mobile content consumption
Wider availability of high-speed internet access has increased the average user’s media consumption experience. Default Wi-Fi accessibility for smartphones and tablets like in coffee shops contributes to the new workplace and a better browsing experience for users. But also the availability of better networks speed (4G and LTE technology) will leverage the mobile content adoption.

comScore Mobile 2013 Content Per Topic

Spot On!
The report shows that 2013 was kind of the “year of mobile”. With the rise of smartphone adoption to an over 50% penetration but also tablets becoming more prevalent, it seems that the world is moving more and more away from desktop internet usage. Mobile devices make up the digital media consumption of consumers these days. Obviously, marketers and media companies need to adapt their businesses to the emerging mobile multi-platform world but should also see the opportunity of mobile car technology (Google Glass Project), Augmented Reality (IKEA), QR codes (Adidas) or “mobile storytelling” (AUDI).

So now up to you. What has changed in your mobile adaption from last year? What are you missing in terms of mobile marketing development? And what would you be open for when marketers address you with mobile content?