Tag Archive for: App

What makes consumers share personal data with brands?

Getting personal data is something most companies strive for. However, consumers are very careful with sharing their information with marketers. Most of them (62%) fear that marketers don’t obey the rules of data privacy. This is the main finding of a recent report from SDL, based The report was based on data from a survey of more than 4,000 consumers in the United States, the United Kingdom, and Australia.

Not surprisingly, younger consumers are not that frightened about the way marketers work with their data than older consumers. In the UK, just 48% of the 18-24 year old respondents worry about it versus 63% of the 45-54 year olds. The US is less open with data sharing in the younger generation. 59% of the respondents between 18-29 years worry about data privacy. This compares to 71% of the age group 45-60 years.

SDL Data Personalized Data 2014

There is also a big gap between what data people share and what not. Data about age, gender, and income is more openly shared with marketers. Respondents made clear that they are less open to share the name of their spouse, lists of family and friends, and obviously their Social Security number.

SDL Data Smartphone Shopping 2014It seems that loyalty programs are still a great hook for marketers. In order to being able to join a loyalty program 49% of respondents were willing to share personal information with brands. Furthermore, free products and services in exchange for data still gets 41% sharing personal data.

Still, the fear of being tracked gets people away from sharing their data online, especially when it comes to in-store tracking. Most respondents (76%) with smartphones replied they are not happy with retailers’ tracking their shopping tours as they do not understand what the intention of the tracking effort will be.

Spot On!
SDL Data Trusted Brands 2014Trusted brands are in a comfortable situation: 79% of respondents stated they are more likely to hand over personal data to those brands they have purchased from before. Obviously, this changes in percentage from country to country with the UK being most hesitant about sharing information Almost one third would not share any information with marketers. The report is a good indicator on what kind of structured data is easy to generate, but also shows the challenge of getting sensitive data from consumers.

Report: How Mobile Apps Monetize

One of the questions, we often get is… What kind of apps make money? Now, an interesting recent report by Distimo and Chartboost based on data from 300,000 apps worldwide with 3.8 billion downloads per quarter sheds some light here. In the Apple App Store free mobile applications with in-app purchases (IAP) get most revenue. The report shows that in-app purchases from free apps went up from 46% to 79% in the United States in only two years (Jan. 2012 to Jan. 2014). The leading countries in this app revenue context are China and Japan with the biggest revenue share (94%) generated from freemium business models.

Distimo Free InApps 2014

Not surprisingly, Germany is one of those different markets again. Here, just 70% of Germany’s revenue was generated from free apps with IAP. The report makes clear that in Germany a bigger revenue share comes from paid business models. However, this is based on the evolution of efficiency enabling tools such as education or navigation which seem to be tools that the German population uses predominantly.

Distimo RevSharePerDownload 2014

The APAC region shows the highest average revenue per download (ARPD). The leader being Japan with an average per download revenue of $5.32. Japan gets followed by Australia $3.60 and South Korea $3.40 places two and three. Canada, Germany, United States and United Kingdom almost generate the same amount per download of around $2.30. China came in last with an ARPD of just $0.92.

Distimo ARPD 2014

Still, this does not mean that the profit is as high as it sounds. In order to figure the profit out, Distimo and Chartboost compared the revenue per download (ARPD) to cost per install (CPI) for the leading 250 apps in the games category in 4Q13. Here, the winners were Japan before Australia, South Korea, the United Kingdom, and the United States.

Distimo APPD 2014

The report shows that there is still money to be made. However, the cost per promotion in the App store or outside the app store should be calculated in. And then, the figures could look massively different…

The Social Media Guard by Coca-Cola

Just in case you spend too much time in social media or network, we found the right thing to keep you away from tweeting, writing status updates or just chatting on one of the messengers that are still “alive” after Facebook nicked WhatsApp. And this is also for those people that forget the world around them by staring into their smartphone where-ever they go.

Obviously, you might need a bit more space around you, your kids might wonder a bit what happened with you, or your cat might challenge the remote control then (as it is also worthwhile for TV addicted).

Just as they say in the video… “The Social Media Guard takes the “social” out of media and puts it back into your life.” What an invention from Coca-Cola and Memac Ogilvy…

YouTube

By loading the video, you agree to YouTube's privacy policy.
Learn more

Load video

Native Advertising: Will these brands turn the advertising industry around?

Last year, I had the pleasure to announce this gentleman for one of the main dmexco stage panels. And I can tell you, it was not fun to complement him to go off stage when their speaking time was up. Terence Kawaja is a funny character and great speaker, and he doesn’t like being stopped talking. Now, the investment banker and founder of LUMA Partners introduced his latest chart of the Lumascapes which will define a new status quo in the advertising industry.

After their numerous Lumascapes on search, display, video, mobile, social commerce, and so on, this time we get to see their perception world of native advertising. Although the definition on native advertising is still evolving and may seem some kind of “rough in barriers” and not very much detailed, it is making it’s way through the brand campaigns of companies. Not even the IAB playbook on native advertising gives us a clear definition on what exactly native advertising is, and how it differs from content marketing, branded content, or even how it can be located against approaches like story advertising.

To the guys of Business Insider, Kawaja said about his latest version…

“Given how consumers ignore banner ads, these new consumer – friendly formats are proving to be the engine for how marketers can engage audiences, especially in social and mobile contexts.”

Let’s hope he his right with his perception. I realized some brands of emerging companies are missing in the chart, maybe as it is an American view, maybe because we are often getting invites to the latest new start-up in this field, maybe as we see the world a bit different. Still, Kawaja and his team have done a good job again. Let’s hope he is joining dmexco 2014 again.

Lumascape Native Advertising

How iBeacon technology can bring interaction in museums

Achieving interaction with customers is a challenging topic. Bringing content on smartphones when people want or need it, is a great opportunity and a smart step to getting people informed and creating interaction – and not only if shops want to spread their brand and reach out to their visitors via Apple’s new iBeacon technology.

The Rubens House Art Gallery in Antwerp -enabled by the guys at Prophets– offers a complete new approach how the gallery can interact with their art fans via sending native location based content on smartphones and tablets. The art gallery uses location based beacons in order to deliver intelligent content in front of paintings around the picture itself, the artist or the time period when it was created. The link between the iBeacons and the content comes from an app the visitor has to download.

Vimeo

By loading the video, you agree to Vimeo's privacy policy.
Learn more

Load video

Apple iBeacon technology applied to classical art in Antwerp Museum from ProphetsAgency on Vimeo.

Study: Why corporate newsrooms fail to meet journalists' needs

Credits: © momius - Fotolia.com

Credits: © momius – Fotolia.com

The value of corporate newsrooms has been discussed for years. Now, a recent Proactive Report survey by Sally Falkow, president of PRESSfeed: The Social Newsroom, gives insights into what the power of newsrooms could be and where journalists stand so far with them. The survey strikes the fact that the PR industry hasn’t adapt to the latest image- and video-based environment that users and journalists alike are looking for; especially videos and embedded codes which only one third of the newsrooms surveyed offered. The report makes clear that the majority of journalists (83%) sees images with content important, still just 38% of them add images to news content.

From Falkow’s perspective, many corporate newsrooms do not provide the content and links that journalists “are looking for, and things they think are important, and things that make their jobs easier for them, and that they would therefore use that content more readily.” The value of pictures for content could be seen when Twitter started displaying pictures in peoples’ feeds, so that users did not have to click the link connected with it, she states.

The main findings from the survey…
– Just 37% of online newsrooms provide videos and embedded codes compared to 82% of journalists asking for it
– 49% of online newsrooms fail to meet the standards of images for publications, only 39% of corporate newsrooms offer an image gallery
– 53% of journalists find video important with content, but only 13% of PR professionals are adding videos to their news, and only one third have a video gallery in their newsroom

So, the question is why companies fail with their newsrooms? Sally Falkow’s answer is as simple as it is obvious: “The No. 1 reason that they quote is lack of resources and, also very close behind, lack of skills. They don’t know how to do it.” Based on the knowledge of their 2013 newsroom study, Peter Ingman, founder of the newsroom technology platform Mynewsdesk, responded: “The power of images and videos have become central parts when coaching companies on how to set up newsrooms with our technology. Providing news and information to journalists has to be three things: simple, simple, simple! It has to be an easy process of uploading data for companies and easy to implement the appropriate content articles and posts for the media contacts. Journalists need to have or find the essential data for their reports and articles without challenging search activities. Come, find, implement – this is the key to successful newsrooms!”

Spot On!
The way journalists work has not changed drastically over the last decade in the way investigating for the news content works. Check the media, check Google, check the brands. Newsrooms offer new opportunities to journalists, social influencers and brand advocates to access data faster with an “everything-at-a-glance” perspective. The use of implemented analysis tools, clever SocialCRM technology, and by changing the way employees are allowed to speak for their brands via online channels, newsrooms foster brand and trust building. However, newsrooms can sometimes be of good and bad experience as the standard in companies newsrooms varies, apart from the different technologies that companies use, from self-developed platforms to personalized SaaS newsrooms.

Often enterprises have got newsrooms up and running already like Daimler, AUDI, ING or Costa Coffee. Still, most SMBs don’t even think about it as they are still relying on their traditional way of spreading news via content distribution platforms – an outdated way in terms of the value it provides for SEO, and even more (or less?) for journalists. Companies should start thinking about providing value with their newsroom in the form of video quotes or brief updates or blog posts alongside photos about the latest developments or news in the company or the market. Quick and simple information bites that come via tweets, Facebook updates or direct mail out of platforms straight to the editor, optimized according to their user behavior. It will make a massive impact on brand reputation and the way journalists will work with corporate newsrooms in the future.

B2B Study: Buyers behavior insights on conversion and engagement

Are you planning your lead generation programs at the moment? Well, you better be quick then. Why? The conversion rates for B2B online lead campaigns generate the best results when the year starts – so now! The reasons are quite obvious: Budget are fresh or renewed. Funds are starting. Conversion falls below average in the Christmas month, probably as of intense planning activity and budget cuts. Not surprisingly, the summer months show a significant decrease in conversion activity.

The findings are coming from some recent analysis by Software Advice, based on data generated from over six million visitors to the Software Advice website in the last 5 years. Although this might be some very detailed experience for the B2B software industry, it is still valid and applicable for the whole b2b industry if they do lead generation programs.

Study Software Advice Conversion By Month

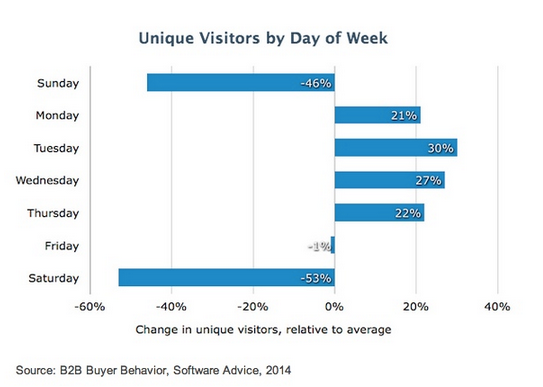
The report shows that B2B buyers were most active on the Software Advice website Tuesday through Thursday, with Tuesday being the most active day and Wednesday driving the highest conversion rates.

Study Software Advice Conversion By Day

Interestingly enough, traffic peaks in the first half of the day, and especially around lunch time. 53% more unique visitors showed up during work hours when compared with Software Advice’s unique visitor traffic.

Study Software Advice Conversion By Hour

Spot On!
Comparing this with other engagement studies from the social media world (here and here), we see that the time around midday seems to be best to get people engaged in content marketing, social media and lead generation. Speaking from our own experience with silicon.de over ten years, I can say that the morning hours when people get their first coffee were also successful in lead and demand generation.

Study 2014: What marketers see as their top priorities

Obviously, all marketers are ROI-driven – or made to think that way. Not surprising then, the top priority in digital marketing comes to be increasing the conversion rates (47%), followed by increasing/improving brand awareness (46%) and collecting/measuring/using behavior-based data (29%). This is the outcome of the latest study by ExactTarget entitled “2014 State of Marketing”. The report, conducted between October and November 2013, gives insights from over 2,600 global marketers.

ExactTarget-2014-top-priorities-exacttarget

Although I would have expected from our conversations with clients that demand generation comes in as one of the top priorities, only 28% of the marketers said acquiring new subscribers, improving channels (24%) and leveraging actionable data is among their main challenges for 2014.

ExactTarget-2014-success-metrics

The good sign for publishers, consultants, advertising platforms and marketing service providers is that 98% of responding marketers plan to increase or maintain their digital marketing budgets. The rise in digital marketing spends goes primarily to data and analytics (61%), marketing automation (61%), email marketing (58%), social media marketing (57%), and content management (57%).

ExactTarget-2014-budgets

Spot On!
It would actually be interesting to have a study that asks marketers what they define as social media marketing. Why? Interestingly enough, only 34% of those marketers find ROI in social media marketing. As of a lack of definition, we cannot argue whether there is a misunderstanding in the definition or in the company’s approach to social media. Still, only 52% think their social media activities will actually pay out in ROI. But when Facebook, Twitter, and LinkedIn are cited as the most popular social channels for the respondents, I doubt that their social media approach is properly understood. At least there are positive signs when the repondents see that Google+ gets more impact with 18% planning to start in 2014.

Texting and Driving? Better use Samsung's "Eyes On The Road" App

Samsung Eyes on the road appThe guys at CHEIL in Sigapore have created a nice app for Samsung that keeps us away from texting and driving. With their “Eyes On The Road” app you can switch your phone into a “Drive Safe Mode” and stay away from taking calls, texts, or even push alerts while driving.
The app technology detects via sensor fusion technology when your speed is above 20km/hr. It then activates the “Drive Safe Mode” and blocks calls, texts and push alerts. Furthermore, it sends automated messages to the people that wanted to get in conversations and let’s them know that we are driving our car at the moment. If not deactivated manually, the app does so after 10 minutes of inactivity.

Now, up to you to use it and for Apple to come up with some similar approach. Or do you not like it…?

YouTube

By loading the video, you agree to YouTube's privacy policy.
Learn more

Load video

Study: Consumers prefer mobile apps to mobile websites

After yesterdays moderation of the dmexco Night Talks in Hamburg on “Mobile – The new first screen”, a recent study grabbed my attention this morning. It makes clear that users really are more into apps rather than mobile websites. According to the findings of the global study from Compuware Corporation, a technology performance company, 85% of consumers responded that they prefer mobile apps over mobile websites.

Although the latest InMobi study gives insights how people react to mobile advertising and why apps get into the centre of attention of the mobile user, the study from Compuware states that the reason why apps become so popular these days. The respondents said that they are “more convenient, faster and easier to navigate.” Furthermore, it adds some more findings…

“Mobile applications are thought to make life easier by streamlining calendars and grocery lists (…) offering entertainment while in line and making it easy to collaborate with co-workers. Consumers now associate apps with banking, paying bills, shopping, booking hotels and travel, as well as with staying productive and connected with both home and office tasks.”

The 3Rs of the social customer also become apparent in the choice of which apps will be downloaded to their mobiles. 84% of users say app store ratings are important in their decisions to download and install a mobile app. And there are some obvious reasons how apps need to deliver in order to be be benefitial…
– Easy access to product and store information
– Help planning and navigating trips
– The ability to communicate in real time

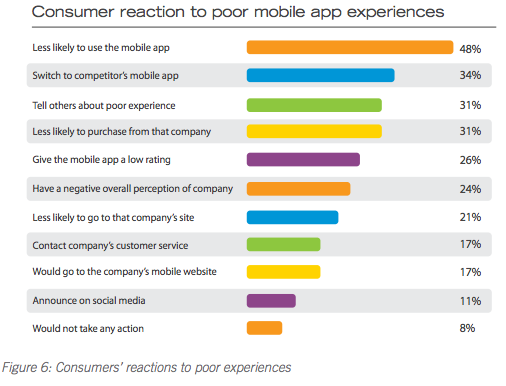
However, the benefits seem quite clear, there are also some complaints about mobile apps. The mobile users mentioned that they had…
– 62% a crash, freeze or error.
– 47% slow launch times.
– 40% an app which just would not launch.

Still tolerance is high when the app does not work immediately. 79% said, they would retry a mobile app only once or twice if it failed to work the first time. Still, companies and brands should be aware that the competitor is not too far away with their mobile app offering.

Compuware - Consumer reaction to bad apps

“With consumers expecting greater experiences with mobile apps now more than ever, fulfilling those expectations doesn’t just happen — it takes a conscious effort throughout every stage of the design and development process to get it right. Performance is a crucial contributor to providing a dependable mobile app user experience, so performance should be considered a key driver in the design process. Mobile applications need to focus on a core utility, and they need to be fast and reliable in order to be valuable.” Stephen Pierzchala, Technology Strategist, Compuware APM Center of Excellence.

It would be interesting to get your expectation on a good mobile app or website? What is your normal reaction when mobile apps don’t deliver to your expectation?