Some years ago, I have written about the Retweet button being the “killer of positive blog comments”. Over the years in many seminars and speeches, I have stressed the point that the ROI of the social web is not about generating high quantity in “thumbs up” on Facebook or Retweets on Twitter, or anything automated that comes along with similar meaning.
Retweets, Repins & Co. are only of value for your business, if…
– you accept those automated response generators as the pillars of your ROI system.
– you are a marketer who builds their business on proving the capability of accelerating reach rather than relevance.
– you are a brand that struggles to understood the value of building a community-centric business.
Still: Are ratings as insightful as a written comment – be it on Twitter, Facebook, LinkedIn or any other community platform out there in the social web?
Yesterday, it became public through a post on TechCrunch that Facebook is testing out a system of openly displaying star-ratings on Pages. Will this be another killer of value creation?
I definitely agree that the Facebook “Like” has become confusing, and in some way worthless. Many users just click on the Like button out of a pure and immediate emotion, nothing sustainable, lasting or resilient. Some are expressing their solidarity with it. Some are missing the dislike button, and click the Like button.
Do those automated responses tell us what they really feel? Do they tell us what people really think? Do they help us to evaluate our position? Fair enough, these automated response creators are some word-of-mouth catalysts. Well, I admit by adding these five star ratings, there is at least some specification in the differentiation of generating feedback.
Obviously, the new rating system puts Facebook in a different position and moves it more to the likes of Foursquare, Yelp and traditional trend shop systems. Furthermore, it allows users to be more concrete in defining their opinions. Users might get better orientation in why a coffee shop or a business or restaurant deserves to be tested.
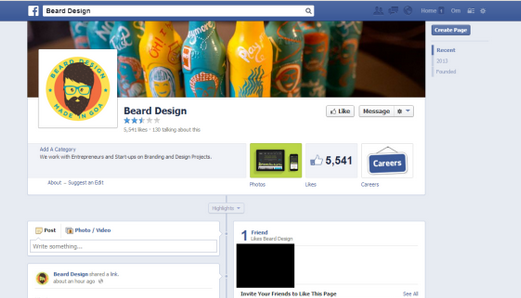
Spotted by TechCrunch
But does it really help us? What is a 4.2 with twelve votes compared to a 4.9 what two people have build up? Do we know who gave the votings, and if these people have the same interest and preferences that we have got? Doesn’t orientation get even more confusing? What will we book on travel websites when there are less and less reviews and recommendations?
Spot On!
The 3 Rs of the social customer (ratings, reviews and recommendations) might make our lives interesting and exciting for new stuff. But maybe there is too much new trends and products out there to get our heads around. Maybe a real review or recommendation will sometimes help (one positive and one negative like Amazon does it already). Still, automated feedbacks -be it stars, RTs, Likes, etc.- are the least valuable insight creation generators on a relevance scale that helps defining internal and external social web ROI.
PS: If your managers are still happy when your numbers of Likes go up, be happy and tell them nothing about this post. If not, let’s discuss further how social networks should constitute in order to deliver deeper insights in the mindset of our customers.