Tag Archive for: Social Media

How fast the leading social networks are growing…

It is one of these questions, we always get asked in meetings and seminars. How much is social media growing, or is growth already declining? Search Engine Journal provides some good overview on the topic of growth and use in an infographic just recently released.

The most popular sites -in terms of how they are used by marketers- are still Facebook, Twitter, and Google+. Same as in the study from Global Web Index in 2013, Twitter still shows the fastest growth in social networks from an active user perspective, especially in the 55-64 age group.

In the time period from June 2012 to March 2013, Google+ increased their active user base by 33%. The age group of 45-54 years showed the fastest adaption growth in Google+ with a 56% increase.

And Facebook? Although they showed a 23% increase, especially the age group of 45-54 years is adapting the fast moving “Likes and Hypes” network.

SEJ-Social-Media-Growth

Tips & tricks on handling blogger advocates (Infographic)

Many marketers ask themselves (and often us) how to work with social influencers or blogger advocates. How can you get them to the some word-of-mouth promotion for your brand, how to spread the word about the company, or just to help on doing some nice networking. The team from SocialChorus gives some advice with their latest infographic on blogger advocates.

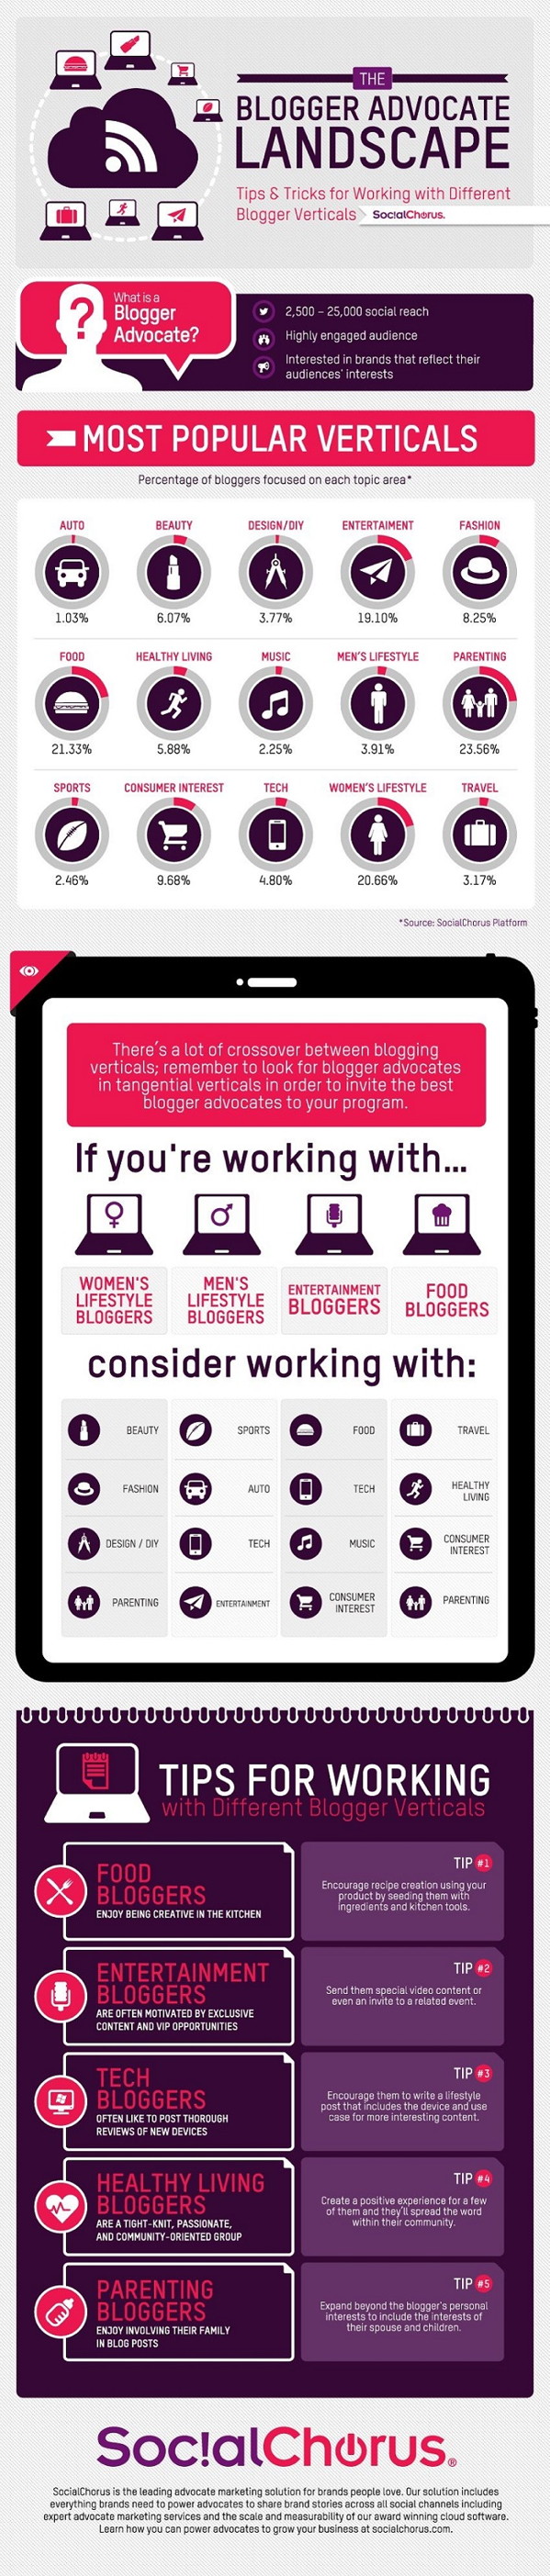
According to their opinion and advice, companies and brands should watch out that the blogger advocate of interest has got at least a social reach of 2,500-25,000 contacts on Twitter and a highly engaged audience. Furthermore, they should be “interested in brands that reflect his or her audience’s interests”. From a verticals point of view, the most popular verticals for blogger advocates come from parenting, women’s lifestyle and food. To be fairly honest,

I was a bit surprised that the tech industry was just getting some 4,8% of mentions as most of these people are in the social media platforms for quite a while, and usually these people are quite engaged. Seems this is not a big vertical when it comes to spreading the message about brands.

However, each vertical can also have some subcategories which means that it could be covered but under a different vertical like i.e. consumer interest. Not surprisingly, the typical women’s lifestyle blog is around beauty, fashion, and design/DIY, while the males’ one will focus more on auto, sports, tech or entertainment.

Spot On!
To be fair, I have to say that I doubt that the number of 2.500+ contacts qualifies for some great advocate impact (maybe more for an influencer), or whether it is not more the people behind those contacts that count. Marketers should also be careful with the “engaged audience” as sometimes people get followed as of their unique content. They get high figures in “automated response” but they might not be the most conversational, still fully respected people.

Hey, who said blogger advocacy was easy? Any further ideas on the topic, feel free to share…

Credits: SocialChorus

Credits: SocialChorus

Content: Secrets of a killer blogpost (Infographic)

Many marketing, PR or product managers think about starting their own blogs when joining one of our inhouse or open seminars. And for most of them, it has become a challenge just finding the right topic that makes them outstanding with their product or service offering. This is not surprising, bearing in mind that there were already 74.874.233 WordPress websites out there when I wrote this post – and when you think about Blogger, Typepad, Tumblrs and all of those enterprise blogs, it becomes a mission impossible to find a niche that helps building brands.

Now, the guys at WhoIsHostingThis.com have published some helpful infographic which give us some quite good arguments on what matters when you start blogging.

Which Content?
There is no magazine without a smashing title. Ideally, you write about the topics you are an expert in. As people will want credible, meaningful and authentic blog posts, this is the only way to get your readers attention. Then, check out what readers do want, discuss and share on your topic via social media monitoring. This will make your content interesting and will prevent you from writing content that nobody reads.

Original or Curated?

If you have got the time to write original content, go for it. It’s the best for your reputation and shows your own mindset. And most importantly, Google likes original content which is more likely to rank better. Whenever, there are guest bloggers who want to contribute to your website, invite them.
However, the truth is that if you curate your competitor’s content or third party content from time to time (with a back link!), you jump into their fish-bowl. The easiest bit is if you use their infographics, webinars and branded industry blogs to expand their ideas and thoughts.

Consistency? 

Find your style and stick with it. People want to feel “at home” and comfortable. Figure out when most people share your updates, or when it’s better not to send them live. If you can afford it, stick to an editorial calendar as people love publishing source they can rely on finding the relevant set of information that stands out.

Good luck (and if you need help), we are here to advice…

How-to-Write-a-Successful-Blog-Post

Edelman Trust Barometer 2014: CEOs recover, social media improving

Another year, Edelman is offering us insights into the trust in companies, officials and their leaders with their Edelman Trust Barometer. This year’s version sampled 27,000 general population respondents with an oversample of 6,000 informed publics ages 25-64 across 27 countries. The study makes clear what the main trust building attributes are.

Edelman Trust Barometer 2014 Attributes

It also shows that CEOs are regaining trust (43%) since low of 31% in 2009. And there are easy ways to improve the trust scale for CEOs and their companies by communicating clearly and transparently (82%), telling the (sometimes unpopular) truth (81%) and engaging regularly with employees (80%).

The downside of the CEO results is that CEOs still rank second to last out of the most credible spokesperson framework. Those more credible were academics (67%), technical experts (66%), “person(s) like yourself” (62%) and employees (52%).

“CEOs must continue to lead, but to do it effectively they now have to inform and empower employees and academics. So whether it’s discussing possible regulation, supply chain management or the reaction to a crisis, CEOs must work in concert with those who are viewed as being more credible.” Alan VanderMolen, vice chairman, DJE Holdings

Edelman Trust Barometer 2014 CEO Trust Building

The report illustrates also that the trust rust in media decreased by 5% globally to 52% this year. When almost 80% of the responding countries state that the trust in media is down compared to 2013, this speaks a clear language. Although this sounds quite negative, some media sources like online search engines (65 percent), traditional media (65%), hybrid media (54%), social media (47%) and owned media (45%) see some improvement to last year.

Spot On!
The 2014 Edelman Trust Barometer is always a good indicator to how much people trust in business and government. And when we see the largest ever gap (14 points) between trust in government and business this year, the leadership teams should try to figure out quickly what the reason for it might be. Although it seems that trust in business leadership improves as it stabalized compared to 2013, it shows that businesses seem to lead government and don’t necessarily need to partner with them in order to gain trust as much as in earlier decades. Thus, it is not surprising that most respondents (84%) think business can pursue its self-interest while helping society. Furthermore, 74% even believe business could be part of the process of formulating regulation in the energy and food industries.

PS: My message to leaders…
Maybe leaders should engage with their employees more and understand what my favorite leaders quote means. “Lead by the power of your employees’ imagination and insights, not the challenges you were given”.

Best and worst times to post social media updates (Infographic)

The questions we get asked by management team all over Europe are quite similar whenever it comes to best possible conversion times, or perfect hours and days to posting on social networks, to send out updates and to generate engagement. Although this might be an option to boost your social and web activities, it should be clear to everyone that if we all obey these options, we are challenging our clients more and more in generating engagement.

Above all, not all social media platforms are alike. The user types of social networks are different, depending on whether these are coming with a purchase intent, the idea to keep their friends up to date about their latest spare time activities, or whether they are looking for new job opportunities in career networks. Sentiment, time and openness for your updates might vary from minute to minute.

Mitt Ray summarizes some advice on when could be the best and worst time to publish your updates on Facebook, Google+, Twitter, Linkedin, Pinterest and Tumblr. Take it for whatever it is worth to you…

Best-Times-and-Days-to-Post-Your-Social-Media-Updates-Infographic

B2B Study: Buyers behavior insights on conversion and engagement

Are you planning your lead generation programs at the moment? Well, you better be quick then. Why? The conversion rates for B2B online lead campaigns generate the best results when the year starts – so now! The reasons are quite obvious: Budget are fresh or renewed. Funds are starting. Conversion falls below average in the Christmas month, probably as of intense planning activity and budget cuts. Not surprisingly, the summer months show a significant decrease in conversion activity.

The findings are coming from some recent analysis by Software Advice, based on data generated from over six million visitors to the Software Advice website in the last 5 years. Although this might be some very detailed experience for the B2B software industry, it is still valid and applicable for the whole b2b industry if they do lead generation programs.

Study Software Advice Conversion By Month

The report shows that B2B buyers were most active on the Software Advice website Tuesday through Thursday, with Tuesday being the most active day and Wednesday driving the highest conversion rates.

Study Software Advice Conversion By Day

Interestingly enough, traffic peaks in the first half of the day, and especially around lunch time. 53% more unique visitors showed up during work hours when compared with Software Advice’s unique visitor traffic.

Study Software Advice Conversion By Hour

Spot On!
Comparing this with other engagement studies from the social media world (here and here), we see that the time around midday seems to be best to get people engaged in content marketing, social media and lead generation. Speaking from our own experience with silicon.de over ten years, I can say that the morning hours when people get their first coffee were also successful in lead and demand generation.

How social search helps marketers boost their brands (Infographic)

How important do you see social search for your brand or your company? Not much. Well, you might reconsider this answer when you have read some of the stats provided by Prestige Marketing in the following infographic.

The compilation of figures and data gives some insights in why brands need to understand the benefits of social search.
– When exposed to relevant branded media, consumers are more likely to click your information: search click-through rates increase 94%.
– Comparable to the Nielsen findings some months ago, 78% of consumers trust personal recommendations over search result rankings.
– In order to make purchase decisions, 48% of digital buyers use search and social media for their buying decisions.

“Social search engines use data from social networks and online relationships, including rating, shares, and likes, to determine the display order of search query results,” claims the infographic.

The following infographic will tell you more about a toppic you might not really be spot on…

trends-in-social-search-infographic

Study 2014: What marketers see as their top priorities

Obviously, all marketers are ROI-driven – or made to think that way. Not surprising then, the top priority in digital marketing comes to be increasing the conversion rates (47%), followed by increasing/improving brand awareness (46%) and collecting/measuring/using behavior-based data (29%). This is the outcome of the latest study by ExactTarget entitled “2014 State of Marketing”. The report, conducted between October and November 2013, gives insights from over 2,600 global marketers.

ExactTarget-2014-top-priorities-exacttarget

Although I would have expected from our conversations with clients that demand generation comes in as one of the top priorities, only 28% of the marketers said acquiring new subscribers, improving channels (24%) and leveraging actionable data is among their main challenges for 2014.

ExactTarget-2014-success-metrics

The good sign for publishers, consultants, advertising platforms and marketing service providers is that 98% of responding marketers plan to increase or maintain their digital marketing budgets. The rise in digital marketing spends goes primarily to data and analytics (61%), marketing automation (61%), email marketing (58%), social media marketing (57%), and content management (57%).

ExactTarget-2014-budgets

Spot On!
It would actually be interesting to have a study that asks marketers what they define as social media marketing. Why? Interestingly enough, only 34% of those marketers find ROI in social media marketing. As of a lack of definition, we cannot argue whether there is a misunderstanding in the definition or in the company’s approach to social media. Still, only 52% think their social media activities will actually pay out in ROI. But when Facebook, Twitter, and LinkedIn are cited as the most popular social channels for the respondents, I doubt that their social media approach is properly understood. At least there are positive signs when the repondents see that Google+ gets more impact with 18% planning to start in 2014.

Study: Business Elite increasingly embraces mobile technology

Harald Wanetschka  / pixelio.de

Harald Wanetschka / pixelio.de

Does mobile technology really have “more influence on global change than countries, governments or corporations”? Well, at least if we can believe in the 50% of respondents of a new European research by CNBC called “Europe’s Mobile Elite 2013”. The study states that Europe’s business elite continue to embrace the latest smartphones, tablets and devices. In general, most European business executives (73%) believe that they are keeping up with technology change within their sector, however almost less than four in ten are not confident with their companies’ technology change.

The study shows that most business leaders own a mobile device (90%), live and like the mobile business and are agreeing that life is “easier” (68%). Even more, 64% see their lives becoming more productive and enjoyable. Apple is still leading with 44% owning an iPhone versus Android users with 35%. Obviously tablets are on the rise as well with almost. The merging worlds of private and business becomes clear with the fact that 72% (up 39% from 2011) use their tablets for both work and leisure.

Not surprisingly, two thirds value tablets “useful business tools”. Also second screen usage is big among the business elite: 75% watch TV at the same time as using their tablet. The engagement effect of the tablet is striking with nine in 10 of these consumers taking some form of action on their tablet as a result of seeing TV content. And when the study shows that a third of the business executives are responding to TV advertising, marketers should think about ow to implement clever brand and lead generation campaigns in their TV spots. And when marketers want to reach the business elite, they are best in sending out their messages in the evening and at weekends (tablet usage). Smartphones are always-on, so no special advice here.
 
“This study shows the huge influence mobile technology has on our lives. Europe’s elite are keeping up with technological change, owning more devices than ever and using each in different ways. In the area of social media and its value in business, the jury is still out and it will be interesting to see where this leads next year.” Mike Jeanes, Director of Research, EMEA, CNBC.

Top content for tablets…  
– business and financial information (72%)
– web browsing (70%)
– news updates (70%)
– email (69%)
– reading newspapers/magazines (69%).

Top content for mobiles…  
– email (79%)
– business and finance (72%)
– web browsing (70%)
– news updates (70%)
– GPS (69%)
 
Spot On!
Despite some common disagreement that the business elite is not on social networks, the study makes clear that 85% are a member of at least one network with 61% on Facebook, 58% on LinkedIn, and 43% on Twitter. It is important to note that 40% (up from 19% in 2011) of Facebook, LinkedIn and Twitter users are now connected to all three social networks. Furthermore, 58% of the business decision makers use social media for business (still private use is the standard for 75%). It could be that private and business worlds are really not kept as separate any longer. The commercial impact of social media is seen critical. When 46% see social media “neither useful nor essential” (compare study 2012), it shows that most business decision makers had either the wrong advice or the wrong expectation raised by consultants. One of the reasons why we are always very critical in analyzing the benefit of social media for a company or brand, and trying to show the realistic benefit for companies.

Customer Service Report: Phone support still top, Twitter comes before Facebook

In an interesting report by Zendesk across the globe, it becomes obvious that telephone is still the preferred way to the customer service of companies. The report shows insights based on actual customer service and support interactions from over 16,000 companies across 125 countries.

According to the Zendesk report, customer all over the world were most satisfied with customer support they received on the telephone. The insights done in Q3 2013 show that 91% of customers liked the way they got help on the phone. In the second place of the satisfaction ranking came Chat (85%), followed by Help Centers/Web Forums (83%). On the social networks side Twitter (81%) came in before Facebook (74%).

zendesk satisfaction cs channel 2013

Not surprisingly, the report also made clear that during normal business hours the support got the slowest first reply times (FRT) plus the lowest satisfaction scores. In the time period between 5-6pm local time -often when the service teams change or leave business for the day- companies have got the longest FRTs.

Interesting to see that Brasil and Canada received the highest customer satisfaction scores although there was no real indications on what the reasons could be. United Kingdom finished in position 6, US in 11 and Germany only in 14. From an industry perspective, the IT services and consultancy business, government and education achieved the highest customer satisfaction rankings.

zendesk industry cs 2013

Spot On!
Companies would be clever to combine these findings with their customer churn and growth rates to see the impact of customer servcie on the development of their customer base. Although many companies do custoemr servcie via Twitter and Facebook, which is steadily growing and improving since 2012 according to the report, we have experienced that social media in customer service if often just used to calm people down and get them engaged in a phone call to solve their issues. A trend that has shown the best customer service satisfaction results.