Tag Archive for: Brand

Study: Largest global corporates get over 10 million mentions a month; Twitter rocks, YouTube grows massively

Companies in the Fortune Global 100 get a total of 10,400,132 online mentions in a month. Twitter is the catalyst for them as it generates the majority of these mentions. However, YouTube is the rising star this year. This is the main findings of the third annual Burson-Marsteller Global Social Media Check-Up, which also includes new data provided by Visible Technologies.

The study states that the majority of the big corporates (87%) are using at least one of the major social platforms. The main growth can be seen at YouTube with 79% of companies now using a branded YouTube channel (57% in 2011). The average performance figures showed more than two million views and 1,669 subscribers. The development is illustrating the importance of integrating original multimedia content that can be shared on the social networks.

Twitter is still the rock-star among the popular social networks in terms of corporate usage. 82% of Fortune Global 100 companies have at least one Twitter account with an average mention of 55,970 times on the 140 character platform. The importance of Twitter ca be seen in the fact that stakeholders are following global companies closely.

Compared to 2011, the average number of followers per corporate Twitter account almost tripled to 14,709 from 5,076. On Facebook, the average number of likes per company page has increased by 275% in two years to 152,646 likes this year.

“People want to interact and connect with these major companies, and these platforms are the bridge directly to the heart of these organizations. What’s even more impressive is how much companies are engaging back with followers. Seventy-nine percent of corporate accounts attempt to engage on Twitter with retweets and @-mentions, and 70 percent of corporate Facebook pages are responding to comments on their walls and timelines.”
Burson-Marsteller, Chief Global Digital Strategist, Dallas Lawrence

Some more findings of the study…

– Fortune Global 100 companies have an average of accounts of: 10.4 Facebook pages, 10.1 Twitter accounts, 8.1 YouTube channels, 2.6 Google Plus pages and 2.0 Pinterest accounts.
– 74% of companies have a Facebook page
– 93% of corporate Facebook get weekly updates
– 48% have joined Google Plus
– 25% are on Pinterest

And whatever else you might want to know about the Top Global 100 you can find here, or within their infographic….

An agency outlook into the future of our information society

Looking into the future of agency business, we have seen horrible visions. This project at Hyper Island by Åse Holte, Fredrik Davidsson, Fredrik Ekholm, Hjalti Axel Yngvason, Kristoffer Jansson & Rasmus Stenbergh gives some positive outlook into motion pictures and information technology, and why brands should consider working with agencies.

The video discusses how motion graphics will continue to influence our daily lives, whether we will have bacterial lanuguage in the year 3.000, if Twitter and Facebook still exist, and or will Google run the world? These are just some thoughts of today’s creative brains…

The main challenge was mentioned by Nico Casavecchia from Boolab addressing companies communication activities “You need to find the balance between commercial and non-commercial work!” However, the opportunities for marketers in the future are nicely put George Giampuranis, Creative Director at Sid Lee into the quote… “You can’t just live in yourself. (..) There are so many more contact points to a brand. Basically any medium that serves as a communication tool.”

Vimeo

By loading the video, you agree to Vimeo's privacy policy.
Learn more

Load video

Information Society from Hjalti Axel Yngvason on Vimeo.

How to detect the ROI of Social Media

Remember when we found some statistics by the Fournaise Marketing Group that mentioned how weak business credibility of marketers in the eyes of their CEO’s is? According to the study 73% of marketers lack business credibility. In the end, it all comes down to what…? Correct: Sales!

Still, 77% of CEO’s think, marketers are not much focussed on sales… according to then study.

The only way marketers can prove their business efficiency is by making their bosses clear how marketing drives sales. However, the question is how Social Media can be beneficial in this process as it is redefining the ROI model that we know from the past. Do marketers need to change their point of reference? Does it matter to look at Social Media numbers, or is it better to focus on business figures? In my eyes the later helps marketers detect the secret sauce.

CEO’s might love marketers for a good promotion. Yes, awareness is never bad. However, they value a sales story creates is much higher. It tells everyone how their lead generation campaign led them to the last sales success which made their pockets full of money. And just imagine how marketers could use that for their social efforts…!

The following infographic by InventHelp gives some insights in how to value social reports for business results. How can marketers determine the ROI of their social media activities? What motivates consumers to like a brand on Facebook? How do successful campaigns on the social web generate the right customers that buy?

Tuesday generates highest engagement for social campaigns

Did you not ever want to know what the best day for a Social Media marketing campaign could be? Well, you can get some good indication with the following study…

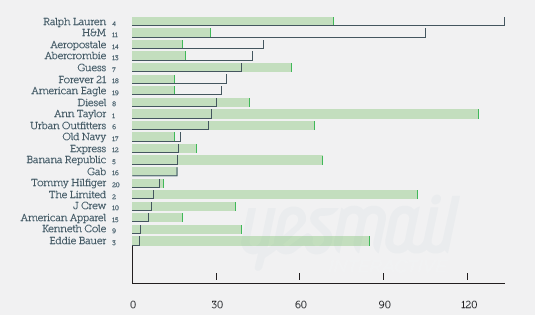
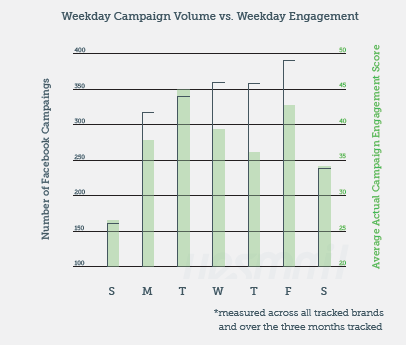
Many Facebook campaigns go live on Fridays. However, the day that generates most user engagement for a campaign on the social network is the Tuesday, which ranked only fourth in terms of the number campaigns conducted. These are some of the findings of a recent study done by Yesmail Interactive. The results are based on a three-month study of consumer engagement with online campaigns for 20 major retails brands, including Abercrombie & Fitch, Gap, or Ralph Lauren among others.

The study with the title “Using Digital Market Intelligence to Drive Multi–Channel Success” figured out the customer engagement of campaigns on the most popular social networks. In order to understand campaign engagement, it compared the relationship between “volume-based engagement” of Facebook campaigns (number of “likes” or comments a campaign generates) and “actual engagement analysis”. The finding is quite obvious, in that the lower the brand “likes”, the fewer likes and comments a brand on Facebook gets. Still, independent of the size of their fan base, some retail brands generate higher engagement levels than others through Facebook. Nevertheless, average-performing brands still performed as engagement winners, including i.e. Ann Taylor, Eddie Bauer or Kenneth Cole. 

Although, we have already reported that a balanced frequency in posting status updates is important for the success of a Facebook campaign, there is no blueprint and guarantee for success. The most engaging brands had deployed between 20 and 32 campaigns per month. Compared to the five least engaging brands with 54 campaigns per month, it becomes obvious that posting less frequently is better. From a timing perspective, the best Facebook engagement was generated for campaigns launching between 10 pm and 12 am Eastern time (EST) which was also the least-used deployment time slot.

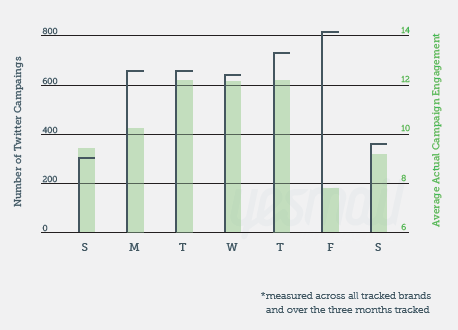
For Twitter, the research showed that most Twitter campaigns (20%) were conducted on Friday, which again is the least engaging day for such campaigns. Almost on the same engagement level performed Tuesday, Wednesday, and Thursday as those most engaging campaign days. Over 84% of all Twitter campaigns were deployed within regular work hours (between 9am and 7pm EST).

The performance of the 20 retail brands on Twitter showed big differences. Although Forever 21 came in first in terms of follower base, the brand’s campaigns showed significantly lower engagement among followers than the campaigns of brands with smaller follower bases.

The five most engaging brands did 45 to 70 Twitter campaigns per month on Twitter versus the five least engaging brands with an average number between 95 and 115 Twitter campaigns per month. It shows again that lower frequency is better than big blast promotions. If marketers want to generate high engagement, they should place their campaigns between 5 am to 6 am and 7 am to 8 am EST.

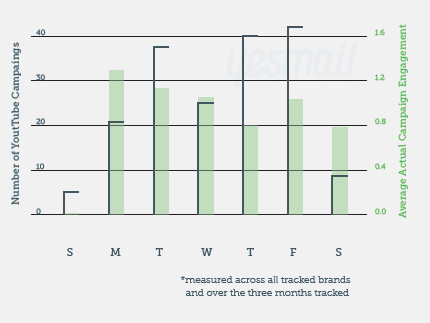
In terms of YouTube campaigns, the study found that 85% of the brands studied have a YouTube channel. Still, just 35% deployed campaigns during the research period. Some more findings indicate that on average, retailers conducted 3.5 campaigns per month during the study. The best day for interaction occurred to be Monday. Do we have to mention that this was the least likely day for campaign deployment? YouTube campaigns deployed between 2 am-3 am EST found the highest engagement rates.

The study is based on campaigns conducted from January to March, 2012 via Yesmail Market Intelligence. The selection of brands focusses on 18-35 year-olds as of their digital communication interest.

5 Tips for Managing an Ecommerce Website

Whether you’re experimenting with online sales or have already run businesses in the past, when you are first creating an ecommerce website you’ll want to keep a few tips in mind. These can help you use today’s technology to find and retain a steady client base.

1. Use Simple Web Design
With such a high degree of competition out there, even for the most obscure products, you’re going to have to put some time and effort into your website to make it stand out from the crowd. You don’t have to have any web design experience to do this if you use an ecommerce software program with templates. These can usually be customized in terms of logo, font, and colour themes. Aside from this assistance, you’ll want to use your imagination and think of a catchy name for your business as well as an easy-to-navigate site.

2. Organize your Product Catalogue Using Categories
A big part of making your online store easily navigable for customers lies in how you organize your products. It’s easier for customers when you arrange your products into logical categories or collections, so that they can find what they’re looking for more easily. Adding a “sale” category can help customers feel that they’ve stumbled onto a bargain, so think about running promotions and sale items as a separate collection altogether. Be sure to include high quality pictures of the products along with descriptions.

3. Make Payment Easy for Customers
Once your customers have located the items that they wish to purchase, some ecommerce business owners feel that they have already sealed the deal. In actuality, this is where it can all go wrong if you make it hard for a customer to pay you. You’ll want a smooth and easy checkout system that offers multiple methods of payment. One example of this would be a Shopify ecommerce website, which provides a shopping cart and integrated payment system. You’ll want to look for a platform of this nature to help encourage the final sale. If you’re selling products internationally, it’s also helpful to include a currency converter. Be sure to provide a telephone number or email address for customer support for added security.

4. Create a Blog
There are numerous ways to market your online store, including using social media and email newsletters, among others. Yet one of the most effective ways to get in touch with a wide net of potential customers is through creating your own blog. This is also a good way to showcase your brand and personality, thus creating a valuable first impression.

5. Use Analytics to Track Customers
Although many online business owners use analytics tools to track what visitors end up purchasing on their website, you can make use of these tracking tools for a host of other purposes. For example, with analytics you can find out how your customers found you, which URL’s are referring customers to your online store, and what search terms they’re using. With this information, you can more tightly hone your marketing efforts to reach a wider audience.

This post is a guest post from Shopify.

Why employers should rethink their attitude towards Social Media…

Many interesting infos have we seen concerning how companies and employers are seeing and opening up their minds about Social Media usage in their offices.

PayScale now comes up with an interesting collection of data based on how employers have adapted Social Media usage for their employees. Some key findings are in the following infographic which makes clear that companies are still in a control mode and have their difficulties becoming “The Social Enterprise”.

– Just a bit more than half of the companies (53%) have a formal social media policy.
– Still 42% of companies don’t allow any forms of Social Media activity at work.
– The smaller the company the more likely the company has a Social Media policy in place.
– With 65% the retail industry is the most evolved industry sector, followed by manufacturing and biz support.
– Energy companies are least likely to use Social Media versus media companies that do encourage their employees.

Spot On!
The infographic shows that there is some kind of ambiguity in the adoption of Social Media inside companies. Although most companies see value in employer branding, in recruiting people through Social Media platforms (80% according to LinkedIn) as well as for external communication like promotions, marketing and PR, many companies still don’t want to go the final mile in transforming their company into a “Social Business”. So, why are they banning the use of these platforms, if they see ROI for their employees in working with it? Isn’t the open and transparent use of Social Media in business more important for the future than it has ever been? For marketing and HR ok, for the rest of the employees not?

Just think about the fact that two out of five Gen Y workers rate Social Media above a higher salary (well, they don’t have kids and family liabilities…). When 56% don’t want a company than bans Social Media companies should rethink their HR strategy and see the value in a Community Centric Strategy

Facebook: Most Engaging Brands

On their way to the IPO planned for later this week, some new data released by the social marketing firm SocialBakers might boost the company valuation from Facebook to a new level. A new infographic takes a look at which global brands have the best Facebook presence.

With 901 million registered global Facebook users, the numbers show that only 17% of the Facebook members are based in the US. The impact and opportunity for companies is massive. The five biggest companies generate each more than 26 million fans with Coca-Cola being the winner, calling 42 million fans their territory on Facebook – more than 21%! The runner up are Starbucks that are best in the food retail sector and Converse.

The SocialBakers figures also show the winning countries where global brands are most engaging their audience. Although the U.S. might be ahead of other countries in population penetration with brands like Starbucks, McDonald’s or Xbox. Brazil is the number two with L’Oreal Paris and Trident (Kraft), India number three with Vodafone and Pepsi, and Germany at least number 10 with McDonalds as well.

It was interesting for me to see that the fastest moving global brands are Halls, Axe, and Nokia – brands that have left my scope of attention in the last three years. Now, it would be freaking cool if we knew which ones of the 488 million mobile users are the most active on brand engagement?

Which brands catch your attention most and where are you most active?

Curiosity – Brand anarchy is to create invisible advertising

Curiosity is it what makes the world get mad. Whether it is IKEA’s smallest shop of the world put in a banner, some invisible commercial.

Lynx, in cooperation with Soap Creative, know how to produce some curious innovative digital art work. They have created this campaign which just went live in Australia. This is the world’s first invisible ad installation. It is using some special LCD screens that can only been seen with polarised glasses.

People passing by in some street in Sydney got some polarised glasses which unlocked the curiosity of the invisible screens, scenes the normal eyes could not see by the naked eye. And finally, then the content was unleashed. Couples were to be seen while having their pleasures and random dogs swimming in a room of water. Actually in my hotel they are swimming on the television but that is another story.

YouTube

By loading the video, you agree to YouTube's privacy policy.
Learn more

Load video

Nielsen study: People trust in peoples' word of mouth

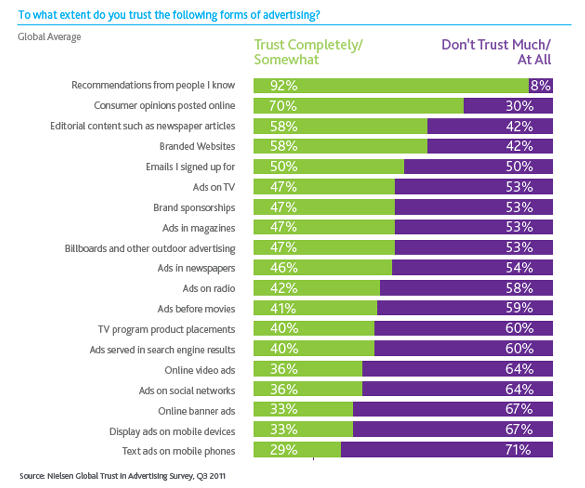
Now, I have used this Nielsen graphic in seminars and conferences for two years and always wondered when the next study is going to be published.

Finally today, I came across the latest Nielsen Global Trust in Advertising report. And again, the results are similar to what they where back in 2009. People still don’t trust advertising. Well, let’s say… at least not as much as they trust recommendations from people they know like friends, family and peers. However, it is still somehow scary to bear in mind that people trust consumer opinions expressed online… very often without verifying who say what in which scenario and which stage of life.

According to the Nielsen findings, which surveyed over 28,000 Internet people in 56 countries, 92% of the respondents said they trust recommendations from friends and family above all other forms of advertising. This equals an increase of 18% compared to 2007. Consumer opinions posted online come in at the second place of most trusted source. Of the consumers surveyed globally, 70% indicated they trust messages from online platforms. This makes up an increase by 15% in the last four years.

Publishing houses and platforms still get a lot of trust from their users. Editorial content (58%) finished in the thread place, just before branded websites (58%), and opt-in emails (50%). The traditional platforms for advertising like print, television, and radio are significantly lower from a trust point of view. The drop in value since 2009 goes down by 24%.

Spot On!
The results show the importance of content marketing carrying the truth about your company, brand or products. Openness, authenticity and transparency are still rated very high amongst your customers. They want to “know what they get”. They want to engage with you but also being told the truth if there is something bad or uncertain to say about brands and their development. And above all they want you to respond to their input. They want you to give them some attention, some feedback, some credit for the time they spend. Then you will earn their trust, and then they will share your voice.

Study: What makes Twitter users trustworthy?

We all want to know what makes us trustworthy, especially when we tweet something. What is the secret sauce that makes others believe in the importance of our tweets? What makes those tweets better than those of our competitors?

The answer comes with a study “Tweeting is believing” from Microsoft and Carnegie Mellon University. In their research the two parties find how companies and individuals can feed their tweets with more credibility, and giving them some of the secret sauce.

So, ok,… the results were no really the deepest insights, but somehow they undermine what many of us might have expected: Gain followers, receive retweets, include URL’s in your posts, set up a profile picture alongside a serious bio with information that correspond with your tweets.

In order to get the right findings the researchers surveyed more than 250 Twitter users factors to understand what makes up credibility in Twitter accounts. These factors got scored from one tot five, five being the highest.

The top-rated factors that make tweets more trustworthy…
1. Tweet was retweeted by someone you trust – 4.08
2. Tweet from a verified subject expert – 4.04
3. Author is someone you follow – 4.00
4. Tweet contains a URL you clicked through – 3.93
5. Author is someone you’ve heard of – 3.93
6. Account has verification seal – 3.92
7. Author often tweets on topic – 3.74
8. Author’s tweets frequently include similar content – 3.71
9. Author’s user image is a personal photo – 3.70
10. Author often mentioned and/or retweeted – 3.69

These were the lowest five credibility lowering factors for tweets…
1. Weak grammar and/or punctuation 2.71
2. Profile picture equals Twitter’s default user image – 2.87
3. User image is a cartoon/avatar – 3.22
4. Author follows many users – 3.30
5. Author’s user image is a logo – 3.37

Spot On!
In many seminars, companies and managers have asked me whether a weak language and incorrect tweeting is destroying the credibility of the brand. They wanted to know whether avatar pictures or brand pictures might affect it. In my eyes, companies should worry more about their general company Social Media standards, their way of collaboration external and internal, and ask themselves why and what they are tweeting about. Tweeting is just a tiny part of your Social trustworthiness….
What are your own experiences? What makes you trust a Twitter user? Any ranking similarities you can see as well?