Tag Archive for: User

Tuesday generates highest engagement for social campaigns

Did you not ever want to know what the best day for a Social Media marketing campaign could be? Well, you can get some good indication with the following study…

Many Facebook campaigns go live on Fridays. However, the day that generates most user engagement for a campaign on the social network is the Tuesday, which ranked only fourth in terms of the number campaigns conducted. These are some of the findings of a recent study done by Yesmail Interactive. The results are based on a three-month study of consumer engagement with online campaigns for 20 major retails brands, including Abercrombie & Fitch, Gap, or Ralph Lauren among others.
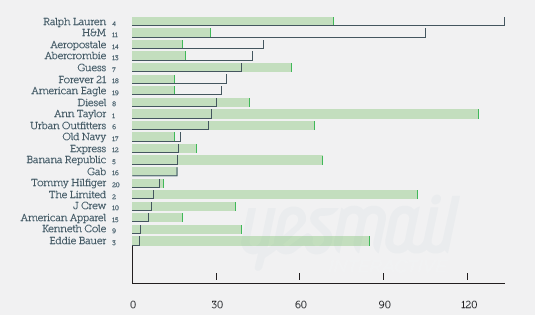
The study with the title “Using Digital Market Intelligence to Drive Multi–Channel Success” figured out the customer engagement of campaigns on the most popular social networks. In order to understand campaign engagement, it compared the relationship between “volume-based engagement” of Facebook campaigns (number of “likes” or comments a campaign generates) and “actual engagement analysis”. The finding is quite obvious, in that the lower the brand “likes”, the fewer likes and comments a brand on Facebook gets. Still, independent of the size of their fan base, some retail brands generate higher engagement levels than others through Facebook. Nevertheless, average-performing brands still performed as engagement winners, including i.e. Ann Taylor, Eddie Bauer or Kenneth Cole. 
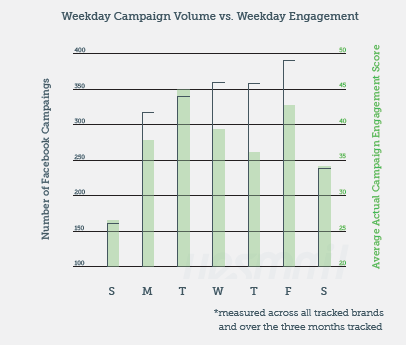
Although, we have already reported that a balanced frequency in posting status updates is important for the success of a Facebook campaign, there is no blueprint and guarantee for success. The most engaging brands had deployed between 20 and 32 campaigns per month. Compared to the five least engaging brands with 54 campaigns per month, it becomes obvious that posting less frequently is better. From a timing perspective, the best Facebook engagement was generated for campaigns launching between 10 pm and 12 am Eastern time (EST) which was also the least-used deployment time slot.

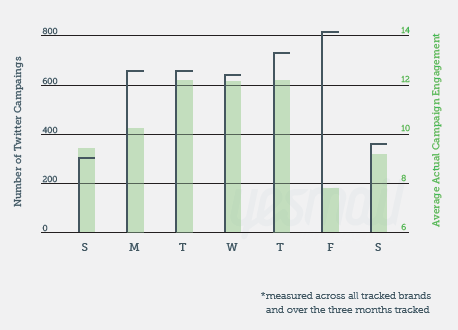
For Twitter, the research showed that most Twitter campaigns (20%) were conducted on Friday, which again is the least engaging day for such campaigns. Almost on the same engagement level performed Tuesday, Wednesday, and Thursday as those most engaging campaign days. Over 84% of all Twitter campaigns were deployed within regular work hours (between 9am and 7pm EST).

The performance of the 20 retail brands on Twitter showed big differences. Although Forever 21 came in first in terms of follower base, the brand’s campaigns showed significantly lower engagement among followers than the campaigns of brands with smaller follower bases.

The five most engaging brands did 45 to 70 Twitter campaigns per month on Twitter versus the five least engaging brands with an average number between 95 and 115 Twitter campaigns per month. It shows again that lower frequency is better than big blast promotions. If marketers want to generate high engagement, they should place their campaigns between 5 am to 6 am and 7 am to 8 am EST.
In terms of YouTube campaigns, the study found that 85% of the brands studied have a YouTube channel. Still, just 35% deployed campaigns during the research period. Some more findings indicate that on average, retailers conducted 3.5 campaigns per month during the study. The best day for interaction occurred to be Monday. Do we have to mention that this was the least likely day for campaign deployment? YouTube campaigns deployed between 2 am-3 am EST found the highest engagement rates.
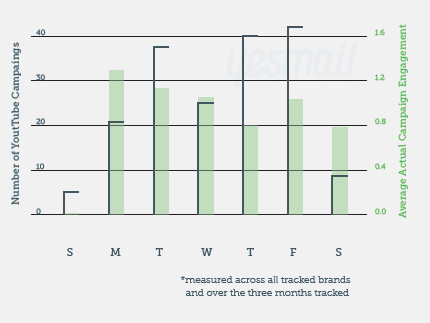
The study is based on campaigns conducted from January to March, 2012 via Yesmail Market Intelligence. The selection of brands focusses on 18-35 year-olds as of their digital communication interest.

Study ConnectedTV – What's the leading strategy?

© carlos castilla - Fotolia.com

GoogleTV or AppleTV? How is the future of connected TV going to look like? TV and Internet companies realize the power of connected TV but are still not quite sure what’s the most effective TV strategy to go forward.

This is the main finding of a recent study conducted by MPP Global Solutions which tried to figure out which company has the best strategy to be successful in terms of the connected TV market. The findings of the study which was done during an online webinar showed that the respondents were undecided on where the successful future could be found.

The research which was called ‘Redrawing the Lines in the Battle for the Living Room’ states that just 26% of senior industry managers identified Apple’s future TV service as successful in the long run. However, this findings was also mentioned by others with 22% who saw Google-TV and Netflix (17%) as creating the right effective strategy for the future. The MPP Global Solutions study analyzed the current position of the connected TV market as a whole and the major players within the industry.

“This inconclusive result reflects the content of the discussion; that the Connected-TV market is still coming out of the early adopter phase and even major players such as Apple, Google and Netflix are still trying to identify the best approach for success”. James Eddleston, Head of Marketing, MPP Global Solutions.

Although some big companies like Google, Apple and the likes are working on their connectedTV strategy, the user is not there yet. A recent study by YouGov found out that just 35% of connected TV owners use their devices for on-demand services, with one in four (25%) having never connected it to the internet at all. It will take time until the user is following the connected TV trend as a whole. The study makers said connected TV sales is set to increase by 70% by 2016.

Spot On!
For companies trying to address the connected TV market, it is essential to develop an effective strategy for the right user experience. Until companies find some intelligent solution the user will probably stay with the magic combination: TV and the second screen: smartphones and tablets. At the moment, users love to do multitasking as we learned from the latest Yahoo and Razorfish study. The respondents of that study said 80% do multitasking while watching TV. More than 60% use their mobiles once or twice while watching TV. And I am quite sure this will stay for quite a while. Or is the split screen a solution? Or the one-in-one program as a time-shift solution? While you change to the internet, the TV program goes in a stand-by mode?

Facebook: Most Engaging Brands

On their way to the IPO planned for later this week, some new data released by the social marketing firm SocialBakers might boost the company valuation from Facebook to a new level. A new infographic takes a look at which global brands have the best Facebook presence.

With 901 million registered global Facebook users, the numbers show that only 17% of the Facebook members are based in the US. The impact and opportunity for companies is massive. The five biggest companies generate each more than 26 million fans with Coca-Cola being the winner, calling 42 million fans their territory on Facebook – more than 21%! The runner up are Starbucks that are best in the food retail sector and Converse.

The SocialBakers figures also show the winning countries where global brands are most engaging their audience. Although the U.S. might be ahead of other countries in population penetration with brands like Starbucks, McDonald’s or Xbox. Brazil is the number two with L’Oreal Paris and Trident (Kraft), India number three with Vodafone and Pepsi, and Germany at least number 10 with McDonalds as well.

It was interesting for me to see that the fastest moving global brands are Halls, Axe, and Nokia – brands that have left my scope of attention in the last three years. Now, it would be freaking cool if we knew which ones of the 488 million mobile users are the most active on brand engagement?

Which brands catch your attention most and where are you most active?

Frequent traveler are the most connected worker

What is almost as important for business travelers as water and food? Smartphones and tablets. They are slowly placing themselves as top necessities. Being accessible at airports, at train stations, or on the tube is simply improving by mobile tools which make them the most connected power users of these tools. The question is whether mobile devices make them more effictient in their business efforts? I think they do…

Business Traveler's Mobile Dependence Infographic, created by PC Housing

Business Traveler’s Mobile Dependence Infographic created by PC Housing

Nielsen study: People trust in peoples' word of mouth

Now, I have used this Nielsen graphic in seminars and conferences for two years and always wondered when the next study is going to be published.

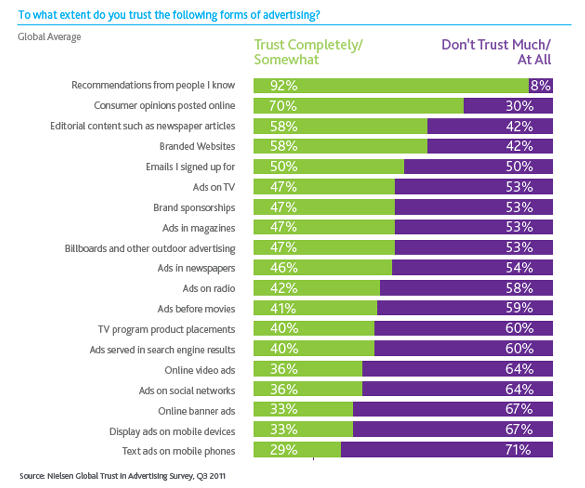
Finally today, I came across the latest Nielsen Global Trust in Advertising report. And again, the results are similar to what they where back in 2009. People still don’t trust advertising. Well, let’s say… at least not as much as they trust recommendations from people they know like friends, family and peers. However, it is still somehow scary to bear in mind that people trust consumer opinions expressed online… very often without verifying who say what in which scenario and which stage of life.

According to the Nielsen findings, which surveyed over 28,000 Internet people in 56 countries, 92% of the respondents said they trust recommendations from friends and family above all other forms of advertising. This equals an increase of 18% compared to 2007. Consumer opinions posted online come in at the second place of most trusted source. Of the consumers surveyed globally, 70% indicated they trust messages from online platforms. This makes up an increase by 15% in the last four years.

Publishing houses and platforms still get a lot of trust from their users. Editorial content (58%) finished in the thread place, just before branded websites (58%), and opt-in emails (50%). The traditional platforms for advertising like print, television, and radio are significantly lower from a trust point of view. The drop in value since 2009 goes down by 24%.

Spot On!
The results show the importance of content marketing carrying the truth about your company, brand or products. Openness, authenticity and transparency are still rated very high amongst your customers. They want to “know what they get”. They want to engage with you but also being told the truth if there is something bad or uncertain to say about brands and their development. And above all they want you to respond to their input. They want you to give them some attention, some feedback, some credit for the time they spend. Then you will earn their trust, and then they will share your voice.

Study: What makes Twitter users trustworthy?

We all want to know what makes us trustworthy, especially when we tweet something. What is the secret sauce that makes others believe in the importance of our tweets? What makes those tweets better than those of our competitors?
The answer comes with a study “Tweeting is believing” from Microsoft and Carnegie Mellon University. In their research the two parties find how companies and individuals can feed their tweets with more credibility, and giving them some of the secret sauce.

So, ok,… the results were no really the deepest insights, but somehow they undermine what many of us might have expected: Gain followers, receive retweets, include URL’s in your posts, set up a profile picture alongside a serious bio with information that correspond with your tweets.

In order to get the right findings the researchers surveyed more than 250 Twitter users factors to understand what makes up credibility in Twitter accounts. These factors got scored from one tot five, five being the highest.

The top-rated factors that make tweets more trustworthy…
1. Tweet was retweeted by someone you trust – 4.08
2. Tweet from a verified subject expert – 4.04
3. Author is someone you follow – 4.00
4. Tweet contains a URL you clicked through – 3.93
5. Author is someone you’ve heard of – 3.93
6. Account has verification seal – 3.92
7. Author often tweets on topic – 3.74
8. Author’s tweets frequently include similar content – 3.71
9. Author’s user image is a personal photo – 3.70
10. Author often mentioned and/or retweeted – 3.69

These were the lowest five credibility lowering factors for tweets…
1. Weak grammar and/or punctuation 2.71
2. Profile picture equals Twitter’s default user image – 2.87
3. User image is a cartoon/avatar – 3.22
4. Author follows many users – 3.30
5. Author’s user image is a logo – 3.37

Spot On!
In many seminars, companies and managers have asked me whether a weak language and incorrect tweeting is destroying the credibility of the brand. They wanted to know whether avatar pictures or brand pictures might affect it. In my eyes, companies should worry more about their general company Social Media standards, their way of collaboration external and internal, and ask themselves why and what they are tweeting about. Tweeting is just a tiny part of your Social trustworthiness….
What are your own experiences? What makes you trust a Twitter user? Any ranking similarities you can see as well?

The value of being "Linkedin"

Although some people still mess about the value of social networking, some platforms have already proven their success and benefit for companies and brands. From a B2B point of view, LinkedIn and Twitter are probably the two platforms that make most sense to marketers.

If Facebook has some value for brands that might be seen more from a B2C perspective. LinkedIn and Twitter have immediate B2B business impact. And business people predominantly use it for people searches it seems to understand their 3 Ps of their business: profession, position and potential.

LinkedIn is the star in this space in terms of business input, lead generation and some deep information exchange with their groups. This infographic from OnlineMBA states some valuable and interesting data about LinkedIn…

– 150m+ professionals globally (LinkedIn company profile stats – February 9, 2012)
– 44m+ members in EMEA region (LinkedIn company profile stats – February 17, 2012)
– registered business professionals from over 200 countries
– executives from every Fortune 500 companies
– 74% have a college degree, 26% even a graduate degree
– 1% of users are responsible for 34% of the traffic
– 1 million new users every 12 days = equals 1 new user per second
– 69% of users with at least $60K annual income
– 39% of users with more than $100K annual income
– 2 Billion people searches in 2010

Pinterest: First facts & findings (infographic)

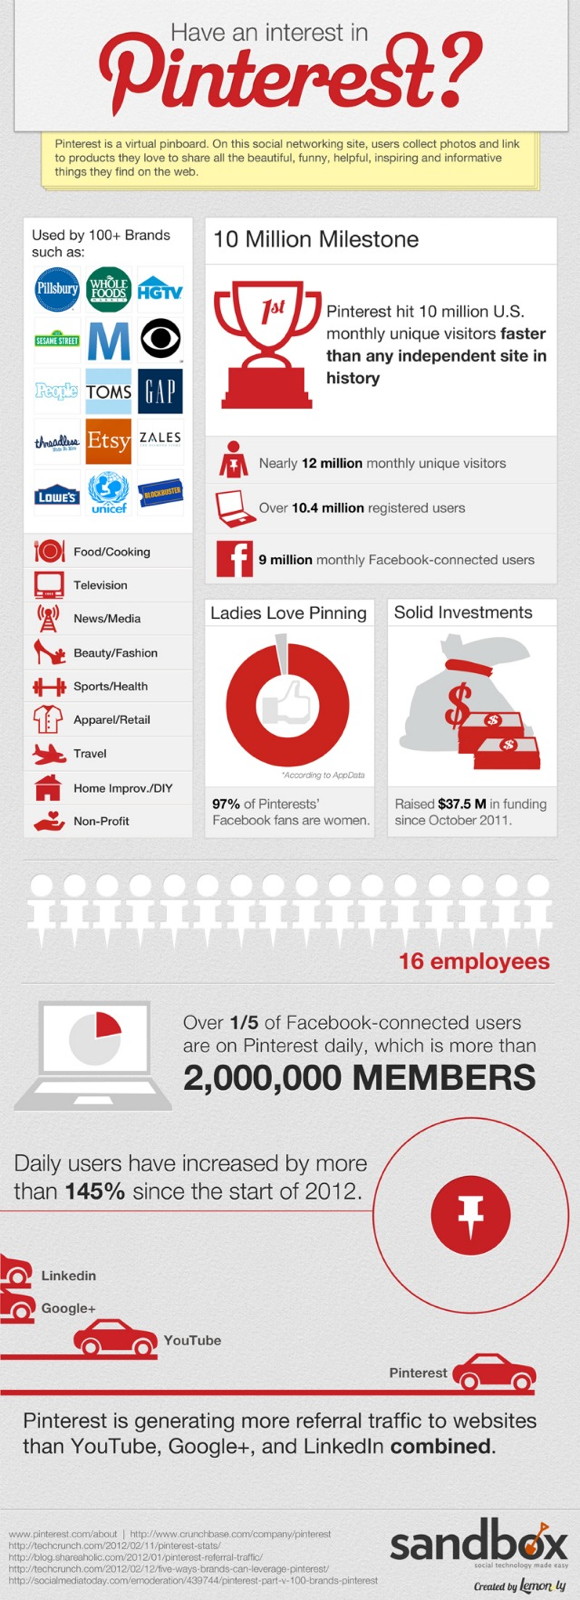
Pinterest is making the world crazy these days in 2012. Are you on it? Sure, most of the Social Media guys out there are exploring ways to make money with it. The funny thing is: You don’t need more than 16 employees to rock the Social Media sphere. That’s the actual size of the company.

A company called Lemon.ly collected some interesting data from the platform Pinterest. They found out that 10 million users are on Pinterest already, 97% of Pinterest’s Facebook fans are women, and it is obvious how the platform might have an influence on designers and marketers.

Some more findings and facts…
– 12 million monthly unique users
– 10,4 million registered users
– 9 million monthly Facebook-connected users
– 145% daily user increase in 2012

What is your perception of the platform? What is the main difference to picture and photo sharing platforms like Flickr, Picasa or Instagram? And what is the benefit using the platform from a business perspective?

Study: Web-traffic boosts in-store sales

In a recent study the research companies comScore, Accenture and dunnhumbyUSA found some significant relevance between in-store sales and a company’s web presence. The study was based on a panel of CPG customers and one million U.S. Internet users who have given comScore explicit permission to have their online activities continuously measured and matched to their in-store brand buying behavior provided by dunnhumbyUSA.
The report comes to the conclusion that consumers who visit a website prior to their shopping experience in a company store spend 34% more with that company and 57% more on products or services based on their specific industry sector. It also states that visitors of brand websites are frequent buyers of the brand in retail stores. It shows that 42% more of these clients finish their transactions than non-visitors. Furthermore, website visitors are also heavier buyers in a brand’s product category. They are spending 53% more in their category dollars than non-visitors.

“Since website visitors have higher affinity to the brand and the overall product category, there is an opportunity for brand marketers to drive loyalty through personalizing the website experience, catering to the preferences of their best customers.”John LaRocca, Vice President, Strategic Partnerships, dunnhumbyUSA

And again another study highlights the importance of content marketing as the new emerging trend in marketing. Shoppers were more aggressive in their approach to understand and evaluate their purchases prior to their visit in shops as a result of the massive information access through the web. According to the research, content marketing plays a significant role here. So, campaigns on the web not only add value to web shopping but also -and for some companies and brands more importantly- will help to drive and boost in-store habits and sales – apart from positioning a brand’s capability.

“Marketers who create compelling (brand) website experiences for consumers are extremely effective in driving incremental and profitable in-store sales. Analysis shows that consumers visiting the best of the 10 CPG brand websites evaluated in the research study, spent over 200% more on the brand than non-visitors.” Jerry Lohse, Senior Director, Accenture Interactive

Based on the fact that Brafton reported some weeks ago that the average consumer visits more than 10 web pages before a purchase decision, this study marks an important point in the relevance between online and offline shopping. This might be catalyzed by the new opportunities that smartphones, tablets or Augmented Reality (see real-life community shopping) offer, and shows the straight relationship between the two shopping experiences which more and more merge to one close shopping cycle.

Spot On!
More companies are realizing that offering web shoppers the same information and service as in-stores will lead to more purchase at both ends of the shopping cycle: online and at offline locations. The challenge for companies is to differentiate the shopping experience by using SoLoMo (social – local – mobile). Here the question for the future will remain whether in-store shopping needs to become more of a lifestyle experience or adventure to attract more consumers to join in-store activity (see IKEA Sleepover), or wether people will want to have real people around them and thus make it a social reality world, rather than a social web world…

Study: Web economy expected to double in G20 by 2016

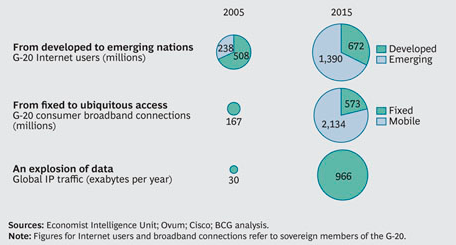
We all know that the web economy is exploding at the moment in terms of activity and users. In the next four years the value of the web is expected to achieve a valuation sum growing from 2.7 to 4,2 trillion pounds. This means that the value of the web economy in the G20 countries is nearly going to double in the next four years.

The global web user base is expected to increase foe 1,9 to 3 million users by 2016 – almost half the world’s current population. All these findings are based on a new report commissioned by the Boston Consulting Group. Still, the report also states that there is at present no standard way of measuring the parts of web economy that is ‘digital’.

Boston sees the growth in the evolution of the mobile web access as 80% are assumed to access the web via smart mobile phones. Thinking back to 2010, which is just about two years back, mobile internet access accounted for just over 4% of the G20 economies. The study makers claim that each household has an approximate valuation of 2,000 pounds worth of purchases online before buying.

Some more key conclusions from the study…


– Digital transformation is key for companies. Companies have to build their digital assets and reduce the digital liabilities that limit their ability to tap rich opportunities. People, processes, and organizational structures need to change and adapt them to the digital world.

– IBM forecasts 1 trillion devices to be connected to the Internet by 2015. This has an effect on the ways companies interact with customers and run their supply chains but also how traditional industries have to build their business.


- Companies such as Amazon, Apple, Facebook, and Google shape the Internet, in China this might be Baidu and Tencent or in Russia Yandex.

– The power of digital experience goes far more local in terms of impact on everyday life, reflecting economic, political, national characteristics and social influences specific to individual countries.

– The “Millennials” have different expectations as employees, consumers, and citizens. TheArab Spring protests and grass-roots “occupy” movements in the West are the most visible manifestations of the power of the Millennials to shape society and commerce.

Spot On!
Seeing the rapid economical and market changes, the intensity of competition will improve and increase. Companies and brands will need to plan more flexible in terms of their strategic approaches how to reach clients than in earlier years when long-term planning cycles were the common status. Today, it will be important to create an adaptive strategy planing and restructuring process.

PS. A challenge might be if evangelist entrepreneuers like this guy spread market distraction and confusion….

YouTube

By loading the video, you agree to YouTube's privacy policy.
Learn more

Load video