Tag Archive for: Marketing

Mobile & Responsive Design: Hype or Hope? (Infographic)

It is a dream for many people responsible in the developer field: Creating a mobile app once, without the need to amend it for any screen, any device or any audience. Responsive web design is said to be able to deliver just that – one size design fits all kind of a thing. But is it really true?

In days where more than 20% of all web traffic is generated via leading e-commerce websites coming from mobile devices, responsive web design is becoming an alternative many developers are thinking about. Not surprising, right?! The unique screen resolutions has been growing from 97 in 2010 to 232 in 2013. For those retailers that wanted to rise the number of online shoppers alongside with the growth of screens coming via not desktop resolutions, responsive design became a new and attractive option.

For the marketing and web optimization guys from Monetate, it seems there is only one real alternative if companies don’t believe in their customers to download their mobile app: responsive web design. Still, mobile shopping is not a hype anymore, it has become the real revenue driver in e-commerce. There is an expected $38.8 billion spend on smartphones and tablets according to eMarketer in America in 2013 which is forecasted to grow up to $108.6 billion by 2017.

However, brands might argue that the development is not cheap at all. If you see another alternative or have the proof that responsive design is not the only alternative, let us know…

Responsive-Web-Design-Infographic

Study: Increase in marketers social spendings expected (Infographic)

With their recent study The Creative Group predicts that the majority of advertising and marketing executives (62%) expect an increase of their company’s spending on Facebook marketing in the follwoing twelve months – 9% more than they predcited one year ago.

Not surprisingly, the advertising spend on Facebook leads the list of social ad spendings. However, the majority of executives will also invest in other channels more than last year: LinkedIn (51% up from 38%) and Google+ (50% from 41%). Twitter is also on the plan for a budget increase with 48%, as well as Youtube (40%), Pinterest (35%) and Instagram (32%)

Although this shows a great breakdown of all industry sectors and job titles in an overview, the different industry segments and job titles varied in their view on budget increase:

Facebook
– Large companies (100+ employees): 74% of marketers expect an increase in Facebook spend
– Smaller companies (100-249 employees): 60% predict an increase for Facebook spendings

Twitter
– 57% of advertising executives expect an increase in spendings
– 48% of marketing executives expect an increase in ad spends
– 12% of marketing execs expect a decrease in spend
– 6% of advertising executives expect a decrease

The study was based on a US survey of 300 marketing executives and 100 advertising executives.

How about your marketing budget planes with Facebook, Twitter and the likes? Increase or decrease?

Forecast-Social-Media-Spend-2013

5% of negative online reviews are deceptive, finds MIT study

© carlos castilla - Fotolia.com

© carlos castilla – Fotolia.com

We all know that ratings, reviews and recommendations -the 3 R’s of the social consumer- rule the modern world of shopping and our daily customer journeys. When we are trying to figure out the coolest holiday hotel, the latest gadget or the cheapest flights, people tend to rely on what online reviews tell them before purchasing whatever they are longing for. Online reviews make a big impact on our life and happiness, and turn the customer journey into a big secret. Nielsen and Forrester have shown in their studies how we find trust in brands and products, and reviews play a significant role in the purchase decision-making processs.

But what if reviews are simply wrong, or bought from people that don’t flag these reviews as hidden content marketing derivates? Years ago, we might have asked our friends or close people where to go for dinner, what music tape to buy, or which book to read, we now just go online and read what some foreigner might have said. No matter which mentality this person has, which preferences, which background, which age and gender. The 3 Rs make our decisions easier, we think.

Although we might have all guessed it, the proof of wrong online reviews now comes with a study from the MIT and Northwestern University that examined over 400,000 reviews in 6 months. The study states that many reviews were simply deceptive, untrue or even written by people who never tested or bought the product or service. In 5% of all negative reviews people get paid to hype products. Most of these people are writing bad and often untrue reviews but are actually newcomer to the business they are talking about. 

The good part of this study is that the study offer some advice for us and tells us how to detect deceptive story-telling.

“What is most compelling is most reviews tend to be too detailed. Another easy clue look for is repeated use of exclamation points. Two, three or four for emphasis, is often associated with deception,” Eric Anderson, Northwestern University Professor and co-author of the study said. “At the end (of the study) we concluded that many of the negative reviews came from customers who were trying to act as self proclaimed appointed brand managers.” Anderson summed up.

Spot On!
However, many reviews might be untrue or bought, it is probably a good way to try to understand what negative reviews are basically saying and balance it against positive reviews. Seeing the positive reviews makes us get out of the bad tonality which often is simply based on anger and frustration around bad services and untrue or bought reviews. And the more people are trying to dive deeper into the intention and personality of the reviews, the faster they might detect if the review is deceptive.

“Really what you have to do is read a lot of them. Don’t just read the 2 or 3 negative ones which may or may not be real–read alot of the reviews.” Ken Bernhardt, former Professor of Marketing, Georgia State University

How the viral video web world is emerging (Infographic)

Audio-video content and video content networks are on the rise. Not one company in the FMCG industry that did not try to start their own initiative around their brand or product in the last two years. From the hype of Social Media another hype was creaping up that many have not yet fully understood but think it might change the world of the advertising industry in the future: viral videos.

The advertising business hopes to make money through Youtube channels and the Google AdSense business. Google invested 100 Mio. US Dollars in the launch of new and original TV content for their Youtube platform, plus they built production studios in London, Los Angeles and Tokyo which might build up Google’s audio-video channel to become one of the main challengers for TV.

Next to the increase of vimeo traffic, more and more video advertising companies arise that produce content, media houses create content hubs as well as PR agencies. Obviously, social advertising companies like Unruly, hallimash or ebuzzing are doing their best to get bloggers implementing and writing about viral ads that their brand customers create. And in the end, the Social Star Awards will make all marketers happy when their virals have made it to become a “viral star”.

The following infographic by the Masters in Marketing Degrees offers some statistics on how the viral web video industry has emerged in the last few years.

The Economics of Going Viral

Survey: Most CMOs and eCommerce execs lack understanding of the mobile experience

Harald Wanetschka  / pixelio.de

Harald Wanetschka / pixelio.de

Mobile is dividing the marketers world. While some say, it is critical to their business objectives, two-thirds admit that they don’t have a strong understanding of the mobile-user experience. This is the main finding of a recent IBM Tealeaf study amoung 582 chief marketing officers (CMOs) and e-commerce leaders. For most companies it is clear how customers behave during the initial awareness stages of the sales funnel. Still, they lack understanding around the purchase stages and the reasons behind cart abandonment.

The study “Reducing Customer Struggle 2013” conducted by Econsultancy shows that marketers now attribute 19% of their total website traffic to mobile devices. Delivering positive customer experience is for 40% of respondents a bigger challenge that on the Web. Herein, bad navigation, small screen sizes and difficulty completing forms were seen as the most serious mobile challenges.

Experiencing a poor custmer experience results for 89% of respondents in working with a competitor. But it seems marketers start understanding the omni-channel customer as they are turning to big data and digital analytics in order to better provide a better mobile experience. And some seem to be real experts in the mobile field: 7% of businesses indicate they have an “excellent” understanding of the overall online customer experience.

The integration of online and offline is still a struggle for most businesses. Most marketers know that information about offline locations, contact details and opening hours on their website is key. But when it comes to establishing a social presence for offline products or services and mobile or local search engine optimization, 93% of the repondents could not get the visibility into individual customer engagement via digital channels.

Spot On!
Seeing their lack in understanding the modern mobile culture, 73% of companies surveyed plan to increase investment in online channels this year. Not surprisingly as mobile is making its way to generate results even in mobile advertising. 6.9bn USD in mobile subscriptions globally seem to be an argument and make 72% invest more in mobile channels. 53% will increase their invest in social. Interesting though that the value of social listening is for most seen ineffective but still they agree social gives insight into what is working and what is not. The looser seems to be offline. More than two-thirds of marketers indicated they either plan to decrease or maintain the same level of investment in offline channels such as stores, shops and branches.

Mobile Advertising: Performance gets better, and Google takes 50% of revenue

mobile-webThere are different views on why mobile advertising is performing. However, some new studies might spread some light: one form TNS and one from SessionM which did their study in cooperation with Millward Brown. The study SessionM published today shows that consumers react positively twice as often to mobile ads… but only as long as they get some value out of it.

Mobile banners are most used from smartphone owners when they get a gift card, coupon, events tickets or loyalty points. Although this gives some good insight in the ranking of the preferred mobile engagement options, consumers want to know what benefit they get out of the digital experience. It means that marketers need to be clever and having some good approach. The surveyed consumers replied that the way mobile ads are presented was crucial to their feedback.

The study makes clear that the mobile strategies need to be clear to the consumer, said Lars Albright, CEO of SessionM: “The questions are, ‘What value am I bringing to the consumer?’ And, ‘How am I doing it?'” It asked 1,000 consumers in a digital survey, as well as a dozen participants in each four hour interviews. 93% of respondents said they had the opportunity to choose a reward in exchange for their smartphone time was “important”. This comes as no surprise after the latest Adobe study telling us that often digital advertising is found “annoying”.

The difference between rewards-based mobile ads and different types of on-the-go promos was that rewards-based mobile ads performed better for purchase consideration (+65), the brand in brand interaction (+14%), branded website traffic (+13%), web searches (+8%), in-store shopping for the brand (+6%), and approaching the brand’s social media pages (+5%). Obviously, the user can be handled and does not always see banners as “annoying and invasive”.

Finally, while a lot of industry players see location-based services as the key to mobile’s future, Joline McGoldrick, research director at Dynamic Logic, Millward Brown’s digital practice, spoke about how interest-level marketing can be a huge help to the space. “Targeting is getting better in mobile,” Joline McGoldrick, Research Director at Dynamic Logicsaid, “but it is still not perfect.”

eMarketer 2013
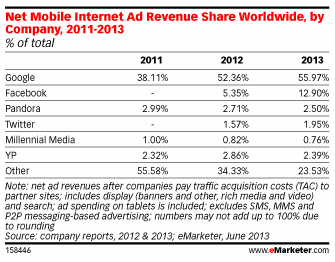
Now, although mobile ad revenue is far from reaching big amounts of ad spendings, many marketers see it as a growth area. Whatever the number that is attached to total mobile ad revenue worldwide is, Google is the leader with over half of surveyed people according to eMarketer. And if you see the numbers it seems that Gogle is still not happy with the budget chunk they do get, reaching out for more it seems. But also Facebook investors will see some light at the end of the tunnel with mobile ads on the rise. However, Google might like the competition but all that market dominance simply making way for some more challenging competition.

It will be interesting to see who will come up as the leader in this cmpetition, who can compete with Google in general, and will Google continue to grow their business? You tell us your views….

My quote of the year 2013 – Social Media, Social Networks and Social Business

Credits: © Mirma - Fotolia.com

Credits: © Mirma – Fotolia.com

In 2010, I started pinning down my main message to companies and their C-level managers in one quote. Thereafter, different quotes evolved which I collected in the vision area of the “About” page.

The value of such a quote is for some managers marginal and for others massive when using it to explain the transformation of the business into a digital community-centric company or brand. Take it for what it is, and for what it’s worth for you, or let’s discuss it.

For this year the quote will be about social business strategy…

“Social Networking is business intend. Social Media is business duty. Social Business is business freestyle.”

Just before you start asking… By “business freestlye”, I address all departments in your company (like marketing, sales, customer service, HR, or other) that are responsible for planning, using, handling, and organizing the business tactics and strategy around the brand, product line or service offering of business relevance.

Some facts that might be interesting for each one of those..
Social Networks – Which are growing fastest?
Social Media – Facts, Figures and Stats 2013
Social Business – Some Facts 2013

PS: If you do it right, your workforce will freak out like the guy in this post. Believe me…!

CMOs: Feeling unprepared for digital challenges ahead? 4 in 10 say YES…!

Sometimes surveys bring out the final truth about the status in which chief marketing officers (CMOs) find themselves in. One of the latest reports by Accenture, titled “Turbulence for the CMO: Charting a Path to the Samless Customer Experience” was done with 405 senior marketers from 10 countries. It makes clear that almost 4 in 10 CMOs think they don’t have the right set up to manage their business challenges in front of them. They are missing the right tools, resources and people.

The annual survey shows a decline in 5% in preparedness compared to 2011. Especially, the digital transformation is lacking behind. Compared to 2011 10% find it challenging to improve their workforce’s responsiveness to digital shifts. Furthermore, CMOs also stated that they find it difficult to keep up the efficiency of marketing operations (8% increase!).

CMO Digital Orientation Accenture 2013

Some deeper findings indicate what CMOs main interest in the business will be. The most interesting observation in the results is that digital orientation has the biggest gap between importance and performance among the five marketing capabilities.

The top priority for them is profitable growth (87%) and operational efficiency (85%). The good point for agencies and consultants is that CMOs have this as a bigger objective that cutting their marketing budgets (58%). From a long-term perspective, consumer expectations for specific experiences have the biggest impact on marketing strategy (65%).

And I am sure, you will detect some more interesting findings in their infographic.

CMO Challenges Accenture2013

Questioning banner efficiency? Native ads perform better than banner ads, says eye-tracking study

A recent eye-tracking study called “Benchmarking the Effectiveness of Native Ads” states that the visual attraction of native ads (52%) is more frequent than with traditional banner ads. The study which used eye-tracking tools was conducted by Sharethrough and the IPG Media Lab with the aim to identify the impact of banner ads of top brand on the web.

The main findings of the study were..
– 71% of respondents described native ads -based on the fact they had previously had a purchase intent- as “personally identify with”; this number stands against only 50% for banner ads
– 32% of respondents argued that a native ad “is an ad I would share with a friend or family member”. However, only 19% would do so with a banner ads
– 25% of respondents looked more on in-feed native ad placements than on banner ads
– Native ads achieve a 18% increase in purchase intent versus banner ads that get a 9% upside for brand affinity. 

Number-views-native-banner-ads-Sharethrough

Spot On!
The interesting point about this study or me was that native ads and editorial content move closer to another. Almost the same percentage of respondents said they looked at native ads (26%) next to editorial content (24%). However, they potentially spend more time viewing the content still compared to native ads.

Engagement-native-ads-content-Sharethrough

Is this another proof for the fact that content marketing is increasingly becoming important and moving in the spotlight of companies and brands? Maybe the infographic helps you find an answer to this question…

Native-ads-vs-Banner ads-infographic-sharethrough-2013

Target-group men: 10 Stats for better marketing

Obviously, there is a difference when targeting men and women. Their purchase behaviour differs in many ways. Who is searching more for coupons, bargains or the latest gadets? According to a report by Microsoft, marketers should have an eye on the right mix between banner advertising, search engine optimization (SEO) or pay-per-click (PPC) tactics in order to address and find men at the right time with the right content in the right context.

Many men, especially young dads (between 25 to 40 years), are influenced by the impact of social networks, according to the report by Performics which we reported quite a while ago. Interestingly enough, 58% of them use four or more sources for their purchase decision. Utilizing social media with story-telling about products and services will make the appropriate impact on men, will give them insights on how companies and brands against their competitors.

Check the infographic published by Brian Honigman and have the 10 stats in mind for the next marketing campaign or tactics when addressing the male audience when your business wants to influence the purchase behavior of men.

PS: If you are interested to see the difference to women, you might have a look at the latest Blogher study here

Target-Men-Marketing-2013